Create Visualization
Start by forking a template
Select a template that fits your needs. Each provides a foundation you can customize.
Constructing Visualizations Reference Examples (React & D3)
Reference examples from the Constructing Visualizations course.


Vibe Coding Templates
Curated starter templates that work well with the "Edit with AI" feature.


Starter Templates
Minimalist starter templates.


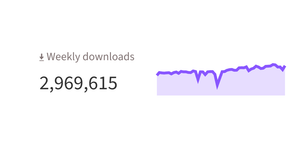
Most Forked
A collection of the most forked vizzes.

Constructing Visualizations

Blank Slate with Hot Reloading

Circles with D3

D3 Transitions
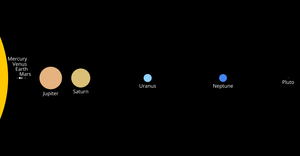
Solar System

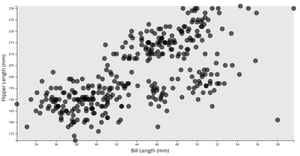
CSV Dataset Template - Penguins

Margins

Viz Function Concept
Scales and Axes
Axis Labels

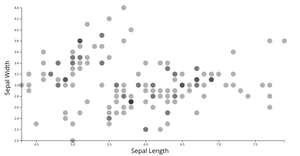
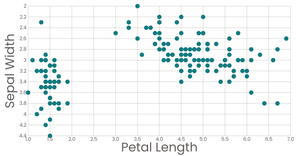
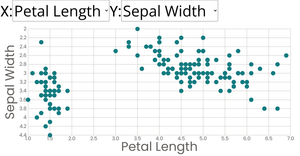
Simple Scatter Plot

Scatter Plot with Missing Data
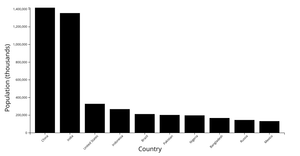
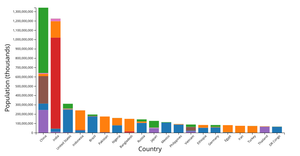
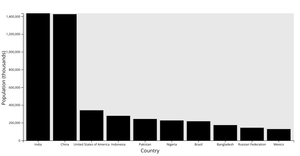
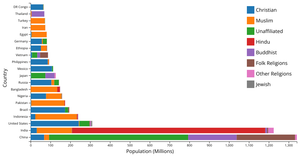
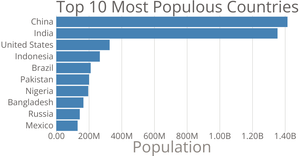
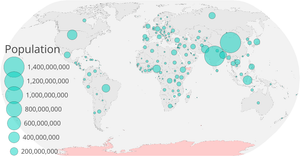
UN Population Estimates 2024
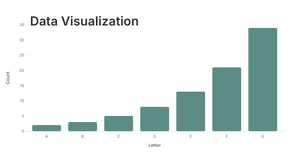
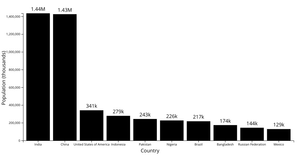
Simple Bar Chart

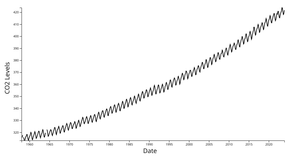
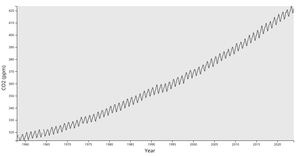
Keeling Curve Data
Simple Line Chart

Mouse Follower

Responsive Viz Container

Responsive Axes
Axes with Hover
Responsive Scatter Plot

Responsive Bar Chart

Responsive Line Chart
Bar Chart with Basic Hover
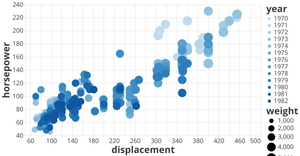
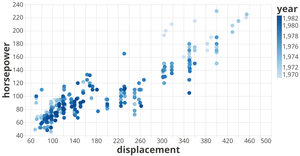
Scatter Plot with Color
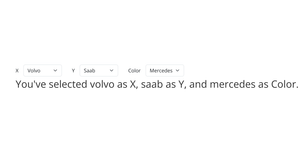
Interactive Color Legend
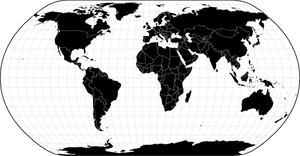
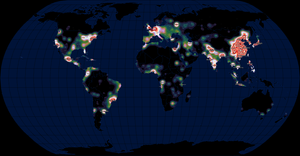
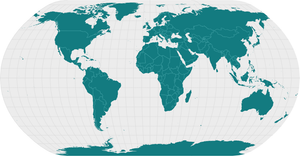
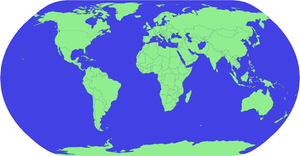
Simple World Map
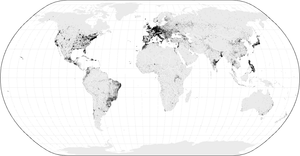
World Cities

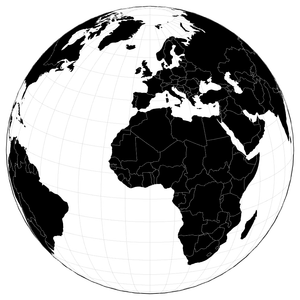
Spinning Globe

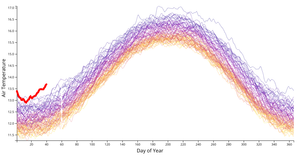
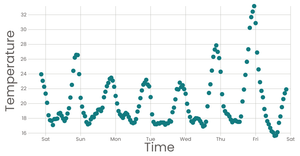
Daily Surface Air Temperature
Line Chart with Multiple Lines
Brushing Circles with D3-Brush

Zoomable Circles with D3-Zoom

Draggable Circles with D3-Drag
Draggable Circles with Voronoi Overlay
Parallel Coordinates with Brushing
Globe with Panning & Zooming

Common UI Elements with D3

Menu with D3
Multiple Menus with D3
Interactive Stacked Bar Chart
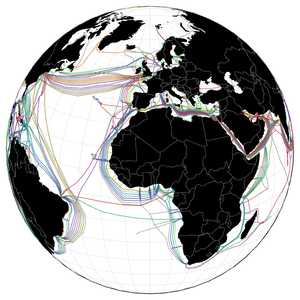
Submarine Cables Globe
D3 Grouped Selections
Code Tree Viz from Livestream
Label Filtering Algorithm Prototype
Interactive Sparkline
Get it Right in Black & White
A collection of projects from the free online course Get it Right in Black & White.

SVG Fundamentals

Fill & Stroke

Pseudo Horizontal Bar Chart

Pseudo Line Chart with HTML

Pseudo Scatter Plot With HTML
Pseudo Slope Graph

Pseudo Circle Packing

Sol LeWitt Reproduction

Sol LeWitt Reproduction with D3

Sol LeWitt Reproduction with D3

D3 Selection Exploration

D3 Selections (with lines)

Double Harmonic
D3 Scatter Plot
Daily new cases of Covid in Italy (Episode 8)
Reusable D3 Scatter Plot
Reusable D3 Scatter Plot with Symbols
Animated Reusable D3 Scatter Plot
Animated Scatter Plot with Menus
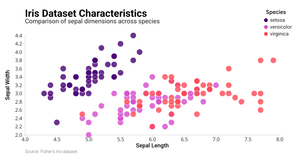
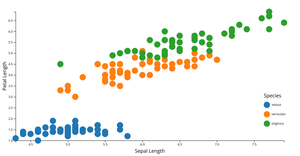
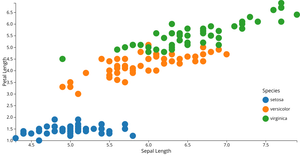
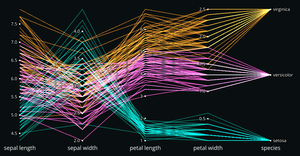
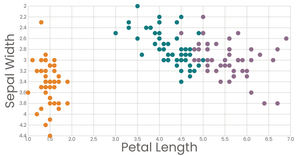
Scatter Plot with Menus Including Species
Analysis using scatterplots

Scatter Plot COVID-19 Vaccination and Cases with Dual Axis
Datavis 2020
D3 & React Examples from Datavis 2020.

Hello HTML

Let's Make a Face Part I

Smiley Face Part II

Smiley Face Part III

Smiley Face Part IV

Smiley Face Part V

Smiley Face Part VI

Mouse Follower

Loading and Parsing CSV Data

Loading Data with React & D3
Vega-Lite API Template

Scatter Plot with Small Points
The Problem of Occlusion
Vega-Lite API Template
Vega-Lite API Template
Vega-Lite API Template
Vega-Lite API Template
Vega-Lite API Template
Vega-Lite API Template
Vega-Lite API Template
Vega-Lite API Template
Vega-Lite API Template

Temperature in San Francisco Area Chart

World Population Area Chart

CO2 Emissions Over Time
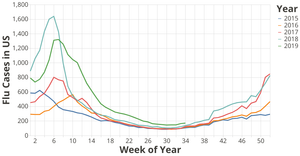
ILINet Flu Surveillance Data
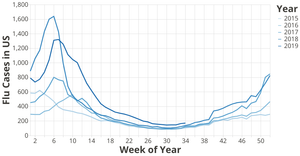
ILINet Flu Surveillance Data

Rendering Data with React & D3

Pathetic Bar Chart

Axes with React & D3
Refactored Bar Chart
Stylized Bar Chart
Stylized Scatter Plot
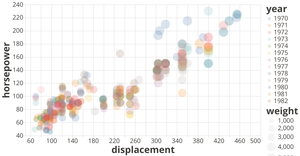
Working with Time
Stylized Line Chart
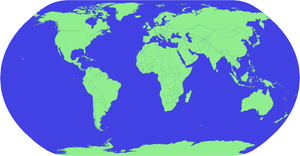
Polished World Map
Menus with React
Scatter Plot with Menus

Polished Scatter Plot with Menus
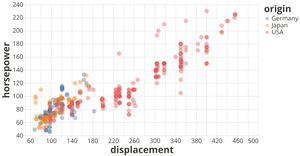
Scatter Plot with Color
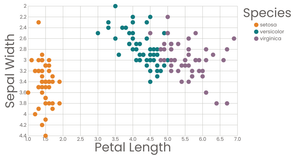
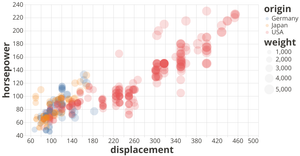
Scatter Plot with Color Legend

Interactive Color Legend
Points on a Map
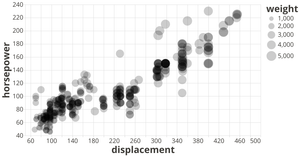
Sized Points on a Map
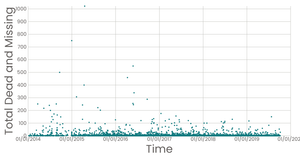
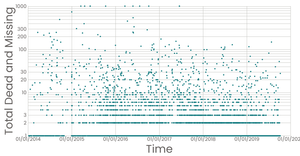
Missing Migrants Scatter Plot
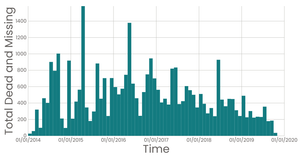
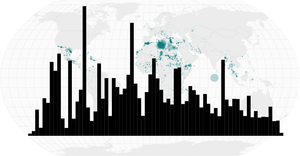
Missing Migrants Date Histogram
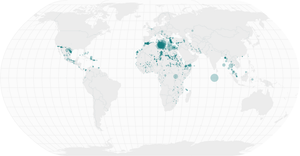
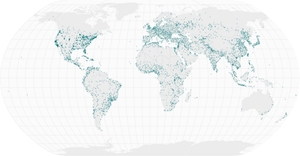
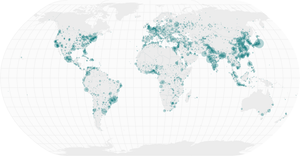
Missing Migrants on a Map
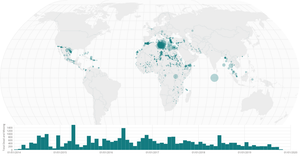
Missing Migrants Multiple Views

Multiple Views Cleanup
Multiple Views with Brushing

Migrant Deaths Linked Views with Fast Brushing
Missing Migrants Scatter Plot Log Scale
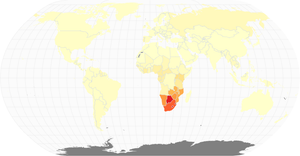
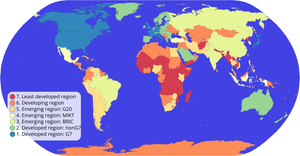
HIV/AIDS Choropleth Map
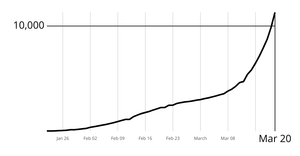
Global Coronavirus Deaths
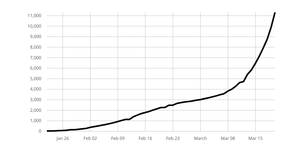
Coronavirus Linear Y Axis
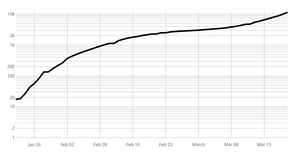
Coronavirus Log Y Axis
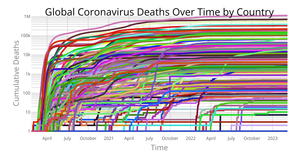
Coronavirus Deaths Over Time by Country

Coronavirus Deaths Over Time by Country With Voronoi Overlay
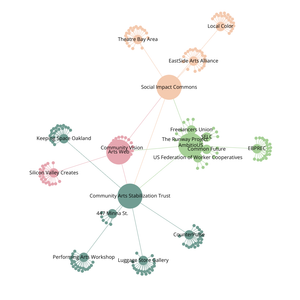
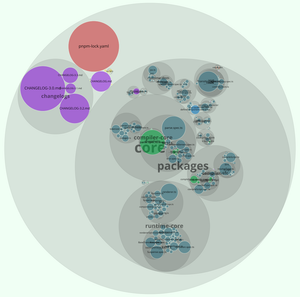
Organization Graph Diagram
Datavis 2018
Old-style visualizations with D3 from Data Visualization Course 2018.
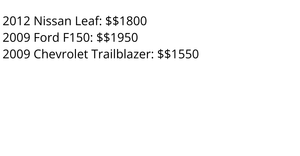
Cars Report

HTML Cars Report
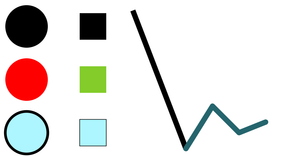
Shapes and Colors with SVG and CSS

Let's make a face with D3.js!

Data Table Summary

Auto MPG Summary
Customizing Axes

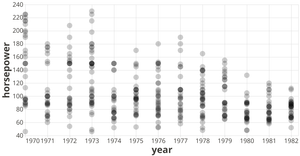
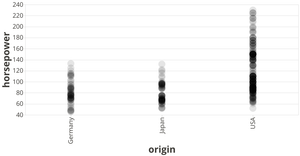
Cars Scatter Plot
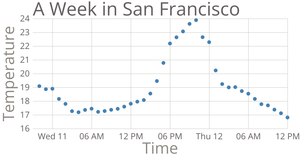
Temperature in San Francisco Scatter Plot
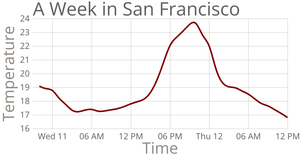
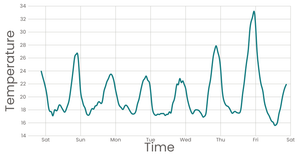
Temperature in San Francisco Line Chart
Temperature in San Francisco Area Chart
World Population Area Chart

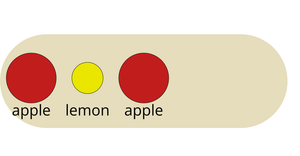
Bowl of Fruit - General Update Pattern

Bowl of Fruit - Animated Transitions
Bowl of Fruit - General Update Pattern Special Cases

Bowl of Fruit - Click to Select

Bowl of Fruit - Hover to Select
Let's make a map with D3.js!
Cheap Tricks for Interaction

Blank Canvas
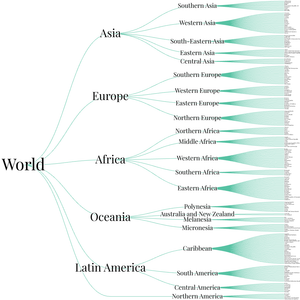
World Countries Tree
Color and Size Legends

Choropleth Map
Choropleth Map with Interactive Filtering

Scatter Plot with Menus
Circles on a Map

Line Chart with Multiple Lines

Melting Data for Multiple Lines

Map with Selectable Countries
