The Keeling Curve Dataset, manually processed to be valid CSV and parsed in code.
The following text came with the CSV file:
"-------------------------------------------------------------------------------------------"
" Atmospheric CO2 concentrations (ppm) derived from in situ air measurements "
" at Mauna Loa, Observatory, Hawaii: Latitude 19.5°N Longitude 155.6°W Elevation 3397m "
" Since December 2022 sampling has temporarily been relocated to MaunuaKea, Hawaii "
" Latitude 19.8°N Longitude 155.5°W Elevation 4145m "
" "
" Source: R. F. Keeling, S. J. Walker, S. C. Piper and A. F. Bollenbacher "
" Scripps CO2 Program ( http://scrippsco2.ucsd.edu ) "
" Scripps Institution of Oceanography (SIO) "
" University of California "
" La Jolla, California USA 92093-0244 "
" "
" Status of data and correspondence: "
" "
" These data are subject to revision based on recalibration of standard gases. Questions "
" about the data should be directed to Dr. Ralph Keeling (rkeeling@ucsd.edu), Stephen Walker"
" (sjwalker@ucsd.edu) and Stephen Piper (scpiper@ucsd.edu), Scripps CO2 Program. "
" "
" Baseline data in this file through 07-Jan-2024 from archive dated 08-Jan-2024 14:25:05 "
" "
"-------------------------------------------------------------------------------------------"
" "
" Please cite as: "
" "
" C. D. Keeling, S. C. Piper, R. B. Bacastow, M. Wahlen, T. P. Whorf, M. Heimann, and "
" H. A. Meijer, Exchanges of atmospheric CO2 and 13CO2 with the terrestrial biosphere and "
" oceans from 1978 to 2000. I. Global aspects, SIO Reference Series, No. 01-06, Scripps "
" Institution of Oceanography, San Diego, 88 pages, 2001. "
" "
" If it is necessary to cite a peer-reviewed article, please cite as: "
" "
" C. D. Keeling, S. C. Piper, R. B. Bacastow, M. Wahlen, T. P. Whorf, M. Heimann, and "
" H. A. Meijer, Atmospheric CO2 and 13CO2 exchange with the terrestrial biosphere and "
" oceans from 1978 to 2000: observations and carbon cycle implications, pages 83-113, "
" in "A History of Atmospheric CO2 and its effects on Plants, Animals, and Ecosystems", "
" editors, Ehleringer, J.R., T. E. Cerling, M. D. Dearing, Springer Verlag, "
" New York, 2005. "
" "
"-------------------------------------------------------------------------------------------"
" "
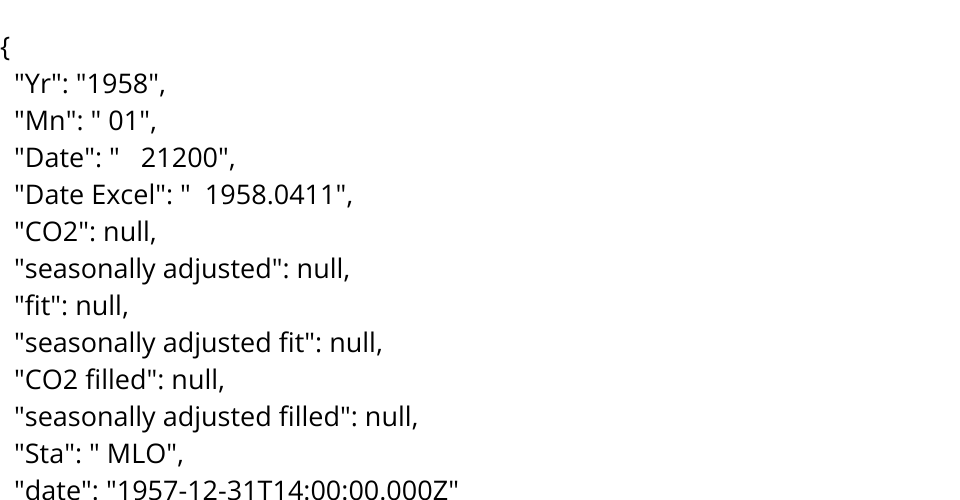
" The data file below contains 10 columns. Columns 1-4 give the dates in several redundant "
" formats. Column 5 below gives monthly Mauna Loa CO2 concentrations in micro-mol CO2 per "
" mole (ppm), reported on the 2012 SIO manometric mole fraction scale. This is the "
" standard version of the data most often sought. The monthly values have been adjusted "
" to 24:00 hours on the 15th of each month. Column 6 gives the same data after a seasonal "
" adjustment to remove the quasi-regular seasonal cycle. The adjustment involves "
" subtracting from the data a 4-harmonic fit with a linear gain factor. Column 7 is a "
" smoothed version of the data generated from a stiff cubic spline function plus 4-harmonic "
" functions with linear gain. Column 8 is the same smoothed version with the seasonal "
" cycle removed. Column 9 is identical to Column 5 except that the missing values from "
" Column 5 have been filled with values from Column 7. Column 10 is identical to Column 6 "
" except missing values have been filled with values from Column 8. Missing values are "
" denoted by -99.99 "
" "
" Column 11 is the 3-digit sampling station identifier. MLO refers to the Mauna Loa Observatory."
" MKO refers the summit of nearby Maunakea. MKO data are used to a fill a gap created by the 2022"
" eruption of Mauna Loa, which led to the shutdown measurements by the Scripps CO2 program at MLO"
" from Dec 2022 through Feb 2023"
" "
" CO2 concentrations are measured on the '12' calibration scale "
MIT Licensed