This template should work extremely well as a starting point for AI-driven iteration.
Iris Dataset Visualization with D3.js
This project demonstrates how to create a scatter plot visualization of the classic Iris dataset using D3.js, a powerful JavaScript library for creating data visualizations in a web browser. It provi
What is D3?
D3 (Data-Driven Documents) is a JavaScript library for producing dynamic, interactive data visualizations in web browsers. It uses HTML, SVG, and CSS to bring data to life.
About This Project
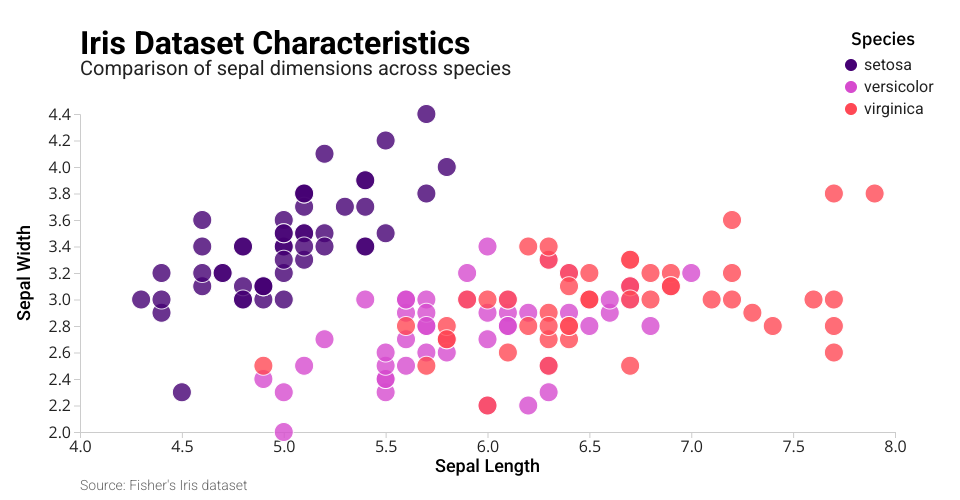
This visualization shows the famous Iris flower dataset, displaying the relationship between sepal length and sepal width across different iris species. Each point represents a flower, colored by spec
How This Works
The Code Structure
This project is organized into several files, each with a specific purpose:
index.js: The main entry point that loads data and orchestrates renderingdata.js: Handles loading and formatting the Iris datasetrenderSVG.js: Creates and configures the SVG containerrenderScatterPlot.js: Creates the scatter plot visualizationobserveDimensions.js: Makes the visualization responsive
Key D3 Concepts Used
- Data Loading: Using
d3.csv()to fetch and parse CSV data - Scales: Converting data values to visual properties (position, color)
- Axes: Creating readable reference lines and labels
- Data Joins: The pattern
selection.data().join()to connect data with visual elements - Transitions & Animations: Smooth updates when data or dimensions change
Getting Started with D3
If you're new to D3, here are some helpful resources:
D3 Key Patterns Explained
The General Update Pattern
D3 uses a pattern called the "General Update Pattern" to create, update, or remove elements based on your data: