Resources
Contact
Pricing
🇺🇸
EN
Log in
Open Editor
Revision History
Export Image
Share
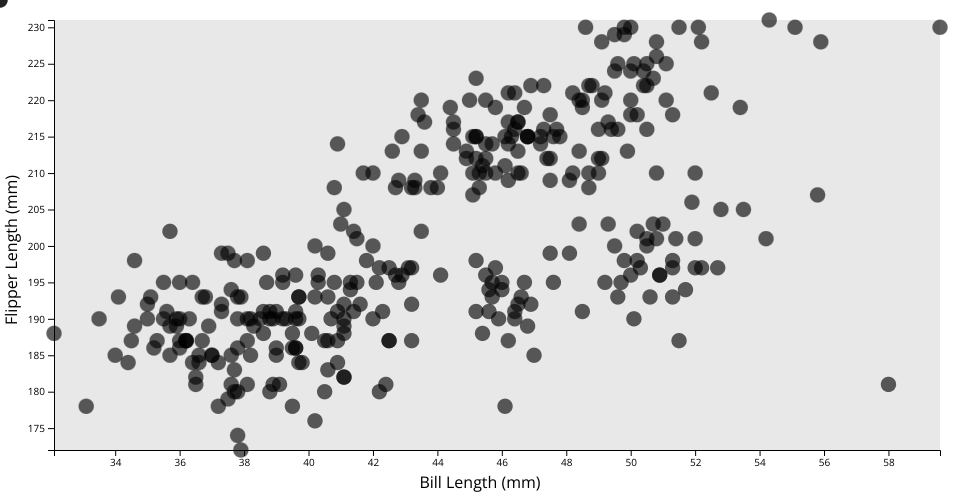
Simple Scatter Plot
122
Forks
0
Likes
Curran Kelleher
0 views in last 90 days
Last edited Mar 03, 2025
Created on Jan 24, 2024
Forked from
Axis Labels
uses
v3 runtime
A simple scatter plot with D3 showing the
Penguins Dataset
.
Challenge
Fork this viz
Modify it to show your data
MIT Licensed