One-Week Data Visualization Sprints
Unlock Your Data's Potential in Just One Week
A production-ready interactive visualization system shipped in one week. For data teams who need a specific question answered visually, with production-ready code instead of prototypes.
Explore
Fork of The Transformation of Kleshas to Wisdoms

Fork of The Transformation of Kleshas to Wisdoms
Fork of The Transformation of Kleshas to Wisdoms

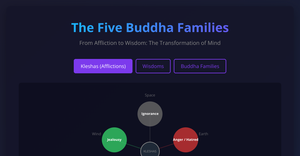
The Transformation of Kleshas to Wisdoms

Fork of React & D3 Starter

Ryan Pseudo Data Vis Learning

Understanding ADHD in Relationships

Fork of Hello HTML

Anger Management Tool

SVG Fundamentals Ryan

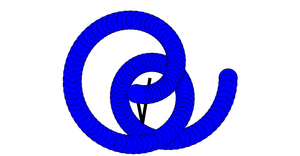
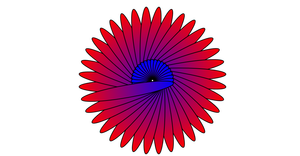
Flower pattern with D3 symbols

Flower animation with D3

Flower with D3
Leaning D3 Selections

SVG Fundamentals
Aesthetic Submarine Cables Globe

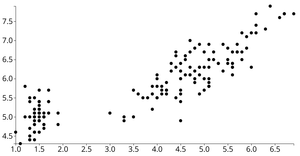
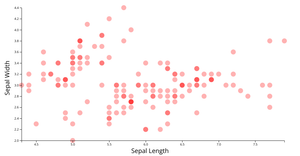
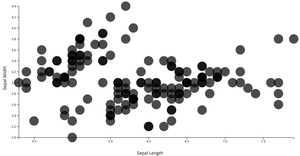
Reusable D3 Scatter Plot
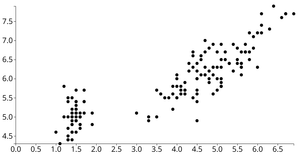
D3 Scatter Plot
Fork of D3 Scatter Plot

Fork of D3 Scatter Plot

Flower pattern with D3 + symbols
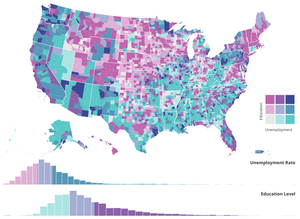
Bivariate Choropleth with Histograms
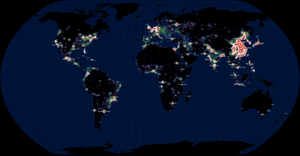
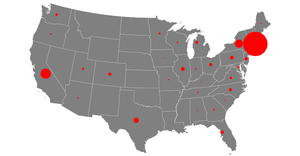
Population Density by World Cities
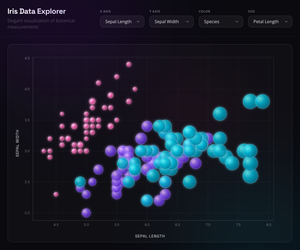
Aesthetic Scatter Plot with Menus
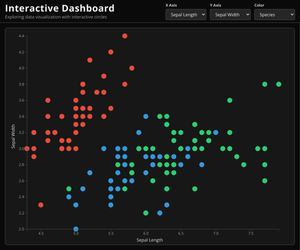
CV: Scatter Plot with Menus

Sol lewitt in d3 after consolidation

Fork of HTML Starter sample

Fork of React & D3 Starter sample

JS in HTML
SVG Fundamentals
Fork of Double Harmonic

D3 Selection Exploration
D3 Selection Exploration

Fork of D3 Selection Exploration

Fork of Fork of Sol LeWitt Reproduction with D3

API DOM

Test44
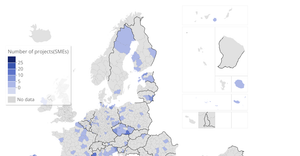
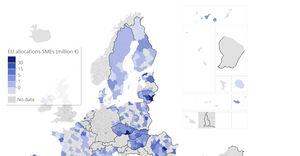
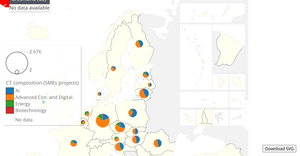
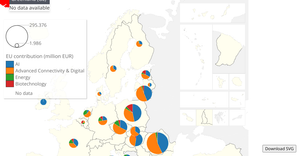
Projectsenergy

JavaScript Arrays
test2

Fork of Hello HTML

DataViz Starter
Fork of CV: Scatter Plot

Fork of D3 Starter
Starting off

Sol de Witt inverse masks

Fork of Sol LeWitt Reproduction - join them

Sol LeWitt Reproduction - Vertical

Fork of Sol LeWitt Reproduction

Fork of Fork of Fork of Adil-sunRise-svg

Fork of SVG Fundamental

SVG FUNDAMENTALS

Sol Lewitt Repro HOR

Sol Lewitt Repro
Fork of CV: Loading CSV Data
Flower SVG

Fork of Fork of SVG Ends

Fork of HTML Starter
Fork of SVG Ends

Fork of CV: Clickable Circles
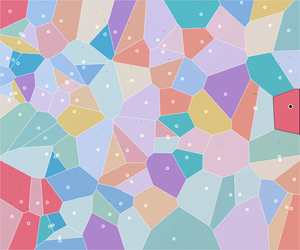
Fork of Fork of Fork of Fork of Fork of #HAW: Svelte + D3: Voronoi

Fork of Smiley Face Part II

Fork of Smiley Face Part II
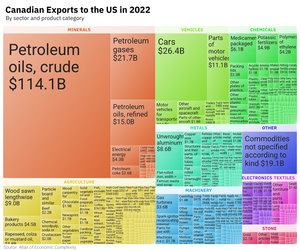
Canadian Exports to US Treemap
JavaScript Arrays

SVG Fundamental

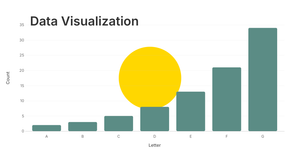
Pseudo Bar Chart

Pseudo Scatter Plot

SVG Fundamentals
Fork of HTML Starter

Fork of Hello HTML

Let's make a face with D3.js!

Smiley Face
Digital BuD

Full Sol LeWitt Reproduction with D3

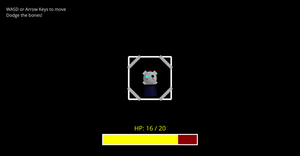
Basic Laberinth

Fork of Sol LeWitt Reproduction with D3
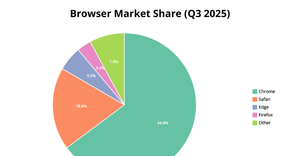
Piechart
Fork of Piechart amount
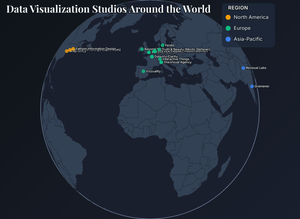
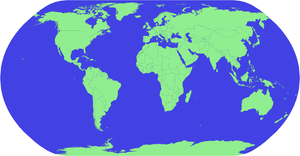
Data Visualization Studios Worldwide

Star Wars Home Planets
Visual Editor PoC

Fork of Smiley Face Part II
Fork of Smiley Face Part II

Fork of Let's Make a Face Part I

Fork of Hello HTML
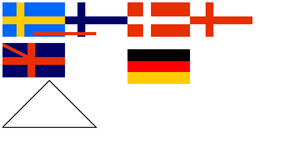
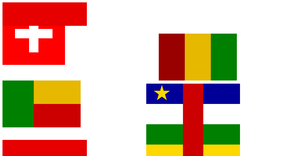
Flags of Europe
SVG Funds
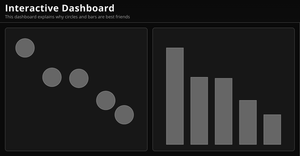
Interactive Dashboard Template
fun word search

Fork of CV: Clickable Circles
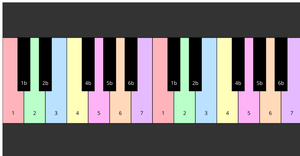
Fork of Fork of Rainbow Piano
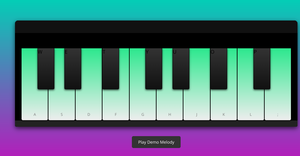
Rainbow Piano

Hearts
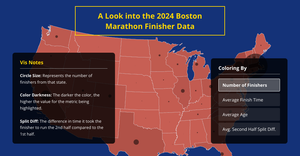
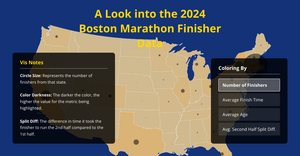
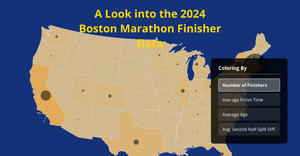
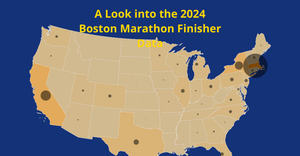
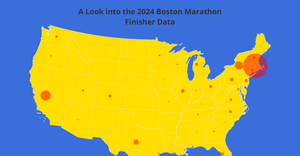
Final Project: 2024 Boston Marathon Data Vis
Final Project Progress 5
Final Project Progress 4
Final Project Progress 3
Final Project Progress 2
Final Project Progress 1

Fork of World Cities
SPOTIFY DATA

Fork of Fork of Hello HTML

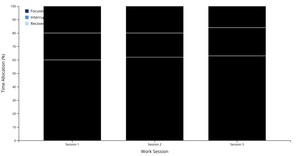
Engagement
Fork of Cheap Tricks for Interaction
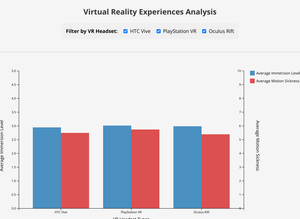
Virtual Reality Experiences
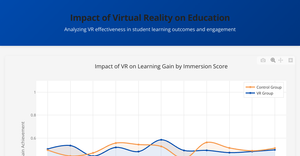
Impact of Virtual Reality on Education
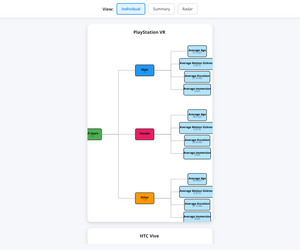
Tree Node Interactions
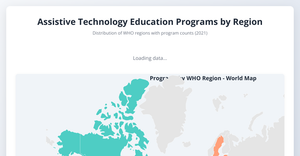
Availability of Education for Assistive Technology
Fork of Fork of Let's make a face with D3.js!
Fork of 3D Cube of Spheres

Fork of 3D Cube of Spheres
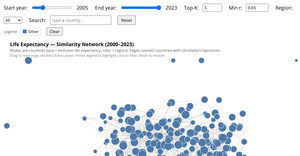
life-expectancy-network-final
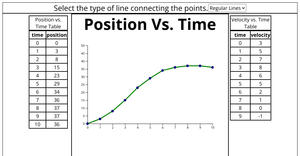
Basic Kinematic Graph and Tables
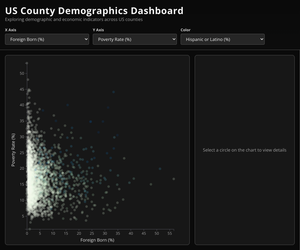
CV: Scatter Plot with US County Facts
website
Fork of Life Expectancy – Similarity Network-polish-v1
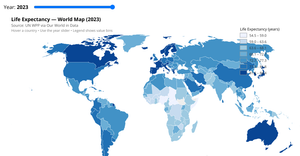
Fork of life-expectancy-map-polish-v1

SVG Fundamentals
Fork of music streaming (Matthias)
Fork of Outlier 2024 Unconf
Fork of React & D3 Vibecoding Starter
Fork of spotify pictogram
music streaming (Matthias)

Fork of music streaming
Fork of Pixar Films Rating Version 2

Spotify Data #HAW
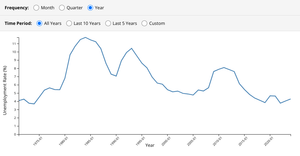
Unemployment rate in UK #HAW

music streaming
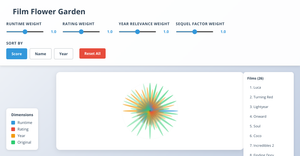
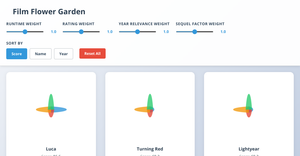
Pixar Films Rating Version 2

#HAW Test Benny Pixar 2
Pixar Films Rating Version 2 (Matthias)
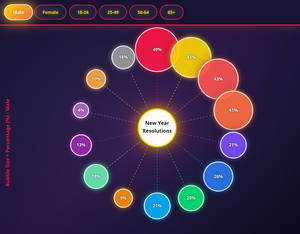
#HAW New Year's Resolutions
HAW Tidy Tuesday Music (Matthias)
Pixar Films
#HAW Benny Test Pixar
Fork of HAW test 5.12
project-SDV 4
project-SDV 2
project-SDV 5
project-SDV 3
Fork of CV: Scatter Plot

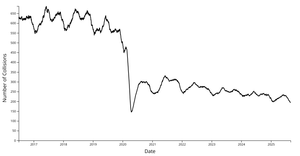
CO2 Emissions Per Year Final
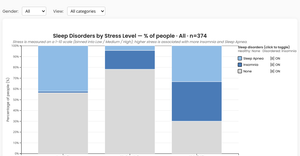
Sleep Health- Interactive Visualization Dashboard

Fork of Globe with Panning & Zooming
1 Final Stacked Bar Chart with HTML

1 Final Stacked Bar Chart with HTML
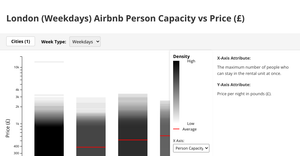
Airbnb Viz Final
Aligned Smoothed Interactive NYC Crash Plot with React & D3
Final Stacked Bar Chart with HTML
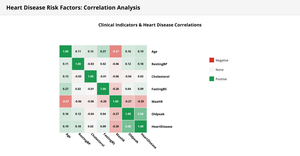
correlation matrix
Activity_7_11815718

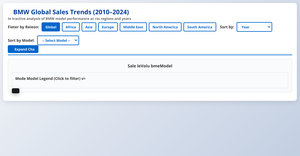
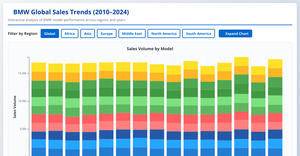
F1 BMW Global Sales Analytics Dashboard
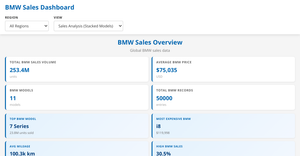
New BMW Global Sales Analytics Dashboard
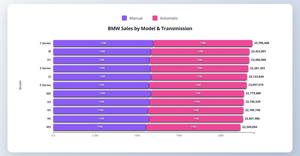
FINAL BMW SALES DASHBOARD
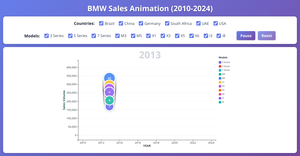
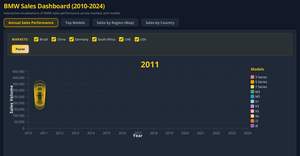
BMW Sales Animation (2010-2024)
Final Bar Chart with HTML and movable filter

Fork of Svelte & Buddha Art

Svelte & Buddha Art