Impact of Virtual Reality on Education
Description
This dataset explores how immersive learning (VR-based) compares to traditional teaching methods in educational settings. It measures the impact of virtual reality on student engagement, learning outcomes, and overall educational effectiveness across different demographics and fields of study.
Source: Kaggle — Impact of Virtual Reality on Education
by waqi786
Link: https://www.kaggle.com/datasets/waqi786/impact-of-virtual-reality-on-education
Dataset Overview
- Total Records: 50 students
- Time Period: Cross-sectional study
- Coverage: Multiple grade levels, fields of study, and geographic regions
Attributes and Types
| Attribute | Type | Description |
|---|---|---|
| Student_ID | Categorical (Nominal) | Unique identifier for each participant |
| Age | Quantitative (Ratio) | Participant's age in years |
| Gender | Categorical (Nominal) | Gender of the participant |
| Grade_Level | Categorical (Ordinal) | High School, Undergraduate, Postgraduate |
| Field_of_Study | Categorical (Nominal) | Subject area (Science, Engineering, Arts, etc.) |
| Usage_of_VR_in_Education | Categorical (Binary) | Yes/No indicator for VR usage |
| Hours_of_VR_Usage_Per_Week | Quantitative (Ratio) | Weekly VR engagement time in hours |
| Engagement_Level | Quantitative (Ordinal) | Scale 1–5 measuring student engagement |
| Improvement_in_Learning_Outcomes | Categorical (Binary) | Yes/No indicator for learning improvement |
| Subject | Categorical (Nominal) | Course subject (Math, Physics, Computer Science, etc.) |
| Instructor_VR_Proficiency | Categorical (Ordinal) | Beginner, Intermediate, Advanced |
| Perceived_Effectiveness | Quantitative (Ordinal) | Scale 1–5 for perceived VR effectiveness |
| Perceived_Sentiment | Categorical (Nominal) | Positive, Neutral, Negative sentiment |
| Geographic_Location | Categorical (Nominal) | Region where study took place |
| Additional_Support | Categorical (Binary) | Yes/No for supplementary learning resources |
Key Research Questions
- Does VR usage correlate with improved learning outcomes?
- How does instructor VR proficiency impact student engagement?
- Are there demographic differences in VR effectiveness?
- What is the relationship between weekly VR hours and learning gains?
- How do students perceive VR effectiveness across different subjects?
Visualization Features
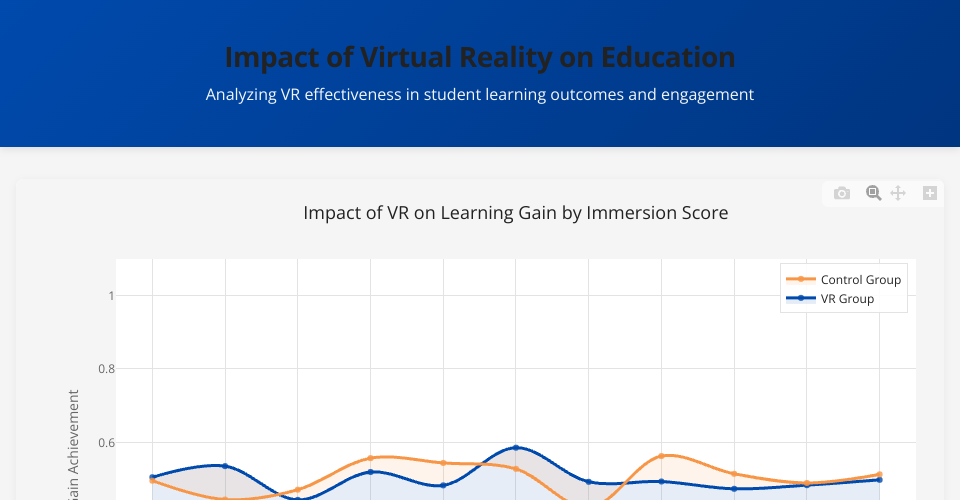
The interactive dashboard displays:
- Primary Visualization: Line chart comparing VR Group vs Control Group learning outcomes by immersion score
- Interactive Legend: Click to toggle group visibility
- Unified Hover: View both groups' metrics simultaneously at each data point
- Zoom & Pan: Explore specific immersion score ranges
- Responsive Design: Adapts to different screen sizes
Data Quality Notes
- Check for missing or incomplete participant data before analysis
- Normalize engagement and effectiveness scores if mixing with different measurement scales
- Treat ordinal variables (Engagement_Level, Instructor_VR_Proficiency) appropriately in statistical tests
- Geographic regions include: North America, South America, Europe, Asia, Africa, Oceania
- Gender categories include: Male, Female, Non-binary, Prefer not to say
Insights to Explore
- Engagement vs. Outcomes: Do higher engagement levels predict learning improvement?
- Instructor Impact: How does instructor proficiency moderate VR effectiveness?
- Subject Differences: Which subjects benefit most from VR-based learning?
- Usage Thresholds: Is there an optimal number of weekly VR hours for learning?
- Demographic Patterns: Do age groups or grade levels show different VR adoption patterns?
Technologies Used
- D3.js: Data processing and manipulation
- Plotly.js: Interactive charting and visualization
- Rollup: Module bundling
- CSS3: Responsive styling with CSS custom properties
Getting Started
- Install dependencies:
npm install - Build the project:
npm run build - Start development mode:
npm run dev - Open
index.htmlin a web browser to view the visualization
MIT Licensed