Tree Node Interactions
Hover Behavior:
- Move cursor over any rectangular node in the tree
- Node brightens slightly and border becomes more prominent
- Tooltip appears near cursor showing:
- Node label (e.g., "Average Motion Sickness")
- Node value (e.g., "5.2/10")
- Node type/context (Root, Gender category, or Metric)
Tooltip Position:
- Tooltip follows cursor smoothly
- Auto-repositions to avoid going off-screen
- Disappears when cursor leaves node
- Smart positioning: appears to cursor right/below when possible, reverses if near screen edge
Radar Chart Interactions
Data Point Hover:
- Move cursor over any colored point on the radar lines
- Tooltip displays metric name and exact value for that gender
- Example: "Male - Average Age: 34.5"
Center Hotspot Hover:
- Move cursor to the center of the radar chart
- Displays comprehensive summary tooltip
- Shows all four metrics for each visible gender category
- Useful for quick multi-metric comparison
Icon Label Hover:
- Move cursor over gender label and count in corner
- Confirmation tooltip appears (e.g., "Male: 152 users")
- Provides quick reference for demographic breakdown
Filter Controls
View Selection (Primary):
- Click "Individual" button to see three separate trees
- Click "Summary" button for consolidated tree + headset filters
- Click "Charts" button for radar visualization + headset & gender filters
- Active view highlighted in blue with solid border
Headset Checkboxes (Summary & Charts Views):
- Click checkbox to include/exclude a VR headset
- Multiple selections allowed and encouraged
- Selection labeled in tree title (e.g., "Summary: PlayStation VR, Oculus Rift")
- Unchecked devices' data immediately excluded from visualization
- All three devices selected by default
Gender Toggle Buttons (Charts View Only):
- Click button to toggle gender category on/off
- Button color fills when gender is selected
- At least one gender must remain selected
- Last selected gender cannot be deselected
- Radar chart updates immediately to show only selected genders
- Icons disappear if their gender is deselected
🚀 Getting Started
Initial Setup
Load the Application
- Open
index.htmlin a modern web browser - No build process or server required
- Works on desktop, tablet, and mobile devices
- Open
Wait for Data Load
- CSV file loads automatically on page open
- Small loading delay (data parsed and converted to numbers)
- Visualization appears once data is ready
First-Time Usage
Select a View Mode
- Click one of three view buttons at top:
- "Individual" (default: shows three trees)
- "Summary" (shows consolidated view)
- "Charts" (shows radar and demographics)
- Click one of three view buttons at top:
Explore Individual Trees (if viewing Individual)
- Three trees display side-by-side (or stacked on mobile)
- Each tree represents one VR headset
- Hover over nodes to learn about metrics
- Trees are read left-to-right: Root → Gender → Metrics
Apply Filters (if viewing Summary or Charts)
- Summary View:
- Use checkboxes to select/deselect VR headsets
- Tree updates instantly to show only selected devices
- Charts View:
- Use headset checkboxes to filter devices
- Use gender buttons to filter demographics
- Radar and icons update in real-time
- Summary View:
Interpret the Visualizations
- Tree size: Larger boxes = higher values
- Tree color: Indicates node type (green=root, blue=male, pink=female, orange=other)
- Radar shape: Pentagon = balanced metrics, pointed star = unbalanced
- Radar size: Larger polygon = higher average values
Generate Insights
- Compare metrics across genders using Summary view
- Check if certain devices cause more motion sickness
- Identify which demographics have longest sessions
- Find immersion correlations with age or gender
🎨 Visual Design System
Color Palette
| Element | Color | RGB | Usage | |
| ----------|- | -------|-- | ------- | ------------------| -- | Root Node | Green | #4CAF50 | All Users total | | Male | Blue | #2196F3 | Male gender category | | Female | | Pink #E91E63 | Female gender category | | Other | Orange | #FF9800 | Other gender identity | | Metric Nodes | Light Blue | #B3E5FC | Calculated averages | | Connections | Gray | #999999 | Tree branch lines | | Background | Off-White | #F5F7FA | Page background | | Cards | White | #FFFFFF | SVG backgrounds |
Typography
- Heading/Title: 14-16px, bold, dark gray (#222)
- Node Labels: 9-10px, bold, black
- Node Values: 8-9px, medium weight, dark gray (#444)
- Tooltips: 12-13px, white text on dark background
- Buttons: 13-14px, varies by state
Responsive Breakpoints
| Screen Size | Layout | Tree Width | Behavior | | | ------------------- | ----------------- | ---------- | ------------------------------ | < 480px (Mobile) | 1 column, stacked | 350px | Vertical stack, touch-friendly | | 480-768px (Tablet) | 2 columns | 380px | Side-by-side pairs, wrapped | | 768-1200px (Laptop) | 2-3 columns | 380-400px | Fills available space | | > 1200px (Desktop) | 3 columns | 400px | Fixed widths, centered |
Interactive Feedback
- Hover Effects: +15% brightness, +1px border width
- Button Active: Blue fill (#2196F3), solid border
- Disabled Elements: 50% opacity, cursor changes to " not-allowed"
- Transitions: 0.2-0.3s ease for smooth animations
💻 Technical Architecture
Technology Stack
| Technology | P urpose | V ersion | | --- ---------|-- | ------------------------------- | ------| |- React | U I component framework | 1 9.1.0 | | D3.js | T ree/hierarchical visualization | 7.9.0 | | Chart.js | R adar chart rendering | L atest CDN | | HTML5 Canvas | 2D rendering for charts | N ative | | ES6 Modules | C ode organization | N ative | | CSS3 | R esponsive styling | N ative |
### File Organization
Data Flow
Browser Support
- Chrome/Edge: Full support, ES6 modules
- Firefox: Full support, ES6 modules
- Safari: Full support, ES6 modules
- Mobile Browsers: Responsive layout, touch-friendly
- Minimum Requirements: ES6 module support, Canvas API, SV G support
📊 Section-by-Section Breakdown
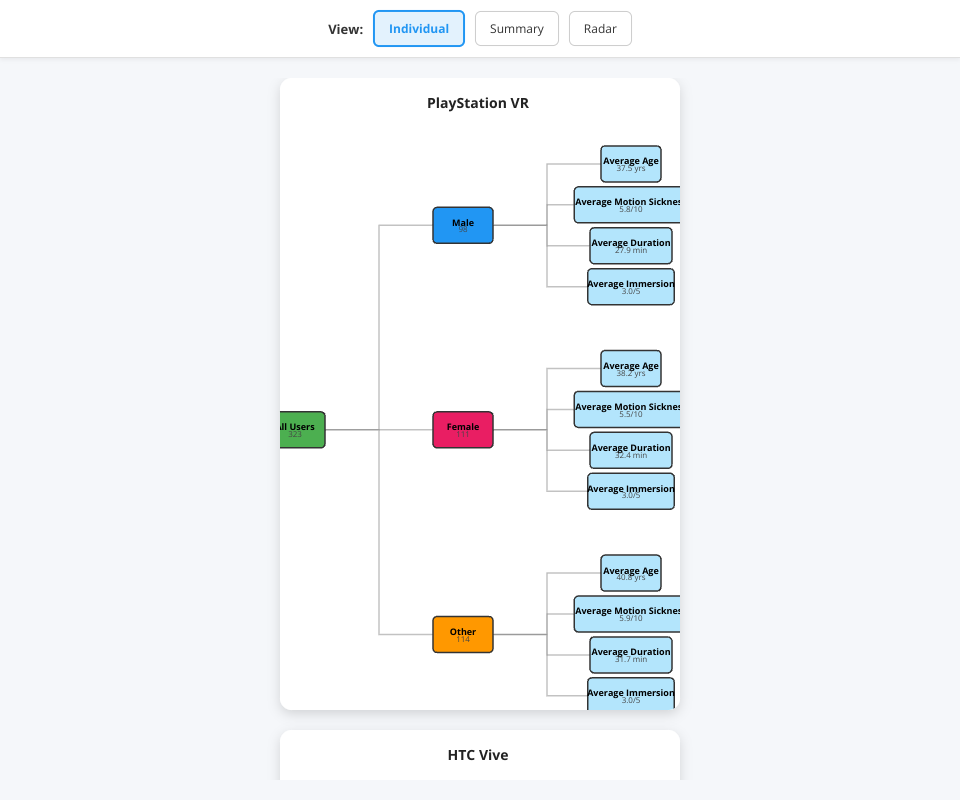
Section 1: Individual Tree Views
What it shows:
- Th ree separate hierarchical visualizations
- One tree per VR headset (PlayStation VR, HTC Vive, Oculus Rif t)
- ll) A)wa grouped by gender with averaged metrics
How to read it:
- Le ft side (green box) = Total users for that headset
- Three branches from root = Male, Female, Other genders
- Right side leaves = Four metrics (Age, Sickness, Duration, Imm ersion)
- Box size corresponds to value (larger = higher number)
Interpretation tips:
- Co mpare tree shapes across devices
- Narrow leaf (e.g., motion sickness = 2.1) = good for that met ric
- Wide leaf (e.g., motion sickness = 8.7) = potential issue
- If one gender branch is much larger, that demographic dom inates that device
When to use:
- In itial exploration of each device
- Understanding device-specific patterns
- Baseline comparison before viewing aggregates
Section 2: Summary View
What it shows:
- Si ngle consolidated tree combining selected headsets
- User count aggregates across devices
- Averaged metrics now represent the combined dataset
How to read it:
- Sa me tree structure as Individual view
- Root node count = sum of all selected headsets
- Gender branches = combined males/females/others from sel ected devices
- Leaf values = averages across the filtered dataset
Filtering workflow:
- U ncheck devices you want to exclude
- Tree regenerates with remaining data
- Title updates to show which devices are included
- Compare different combinations to find patterns
Interpretation tips:
- If PlayStation VR + Oculus shows high motion sickness but ind ividually they're low, different user demographics
- Subset comparison: try just PlayStation + HTC to see if pat tern holds
- Watch how averages shift as you add/remove headsets
When to use:
- Ma rket-wide analysis across devices
- Testing hypotheses about user behavior
- Comparing subsets (e.g., "do premium devices attract dif ferent users?")
- Generating management reports
Section 3: CharRadarWhat it shows:**
- Ra dar chart with four metrics plotted in 2D space
- Gender icons in corners with demographic counts
- Center hotspot for summary statistics
Radar Chart Explanation:
- Ea ch axis represents one metric (Age, Motion Sickness, Dur ation, Immersion)
- Each colored polygon = one gender's data
- Polygon size/shape shows relative performance across met rics
- Overlapping areas show similarities between genders
Reading the Radar:
- ** Large polygon:** Gender has high average values
- Pointed corners: Good performance in specific metrics
- Rounded polygon: Balanced performance
- Small polygon: Lower average values
Gender Icon Components:
- ** Visual icon:** SVG figure illustration in gender color
- Label: Gender name
- Count: "n = X" shows number of users in that dem ographic
- Position: Top-left (Male), Top-right (Female), Bot tom-left (Other)
Filtering on Charts:
- ** Headsets:** Check/uncheck to include/exclude devices fro m radar
- Genders: Click buttons to show/hide gender polygons
- Constraints: Must have at least one gender visible
Interaction features:
- Ho ver data points → see specific metric value
- Hover center → see all metrics summary
- Hover icons → confirm user count
Interpretation tips:
- If Female polygon is much larger, females in your dataset rat e things higher
- If Male age point is far right, males are older on average
- Comparing radar shapes: are males more immersed? Do fem ales experience more sickness?
- Test filtered subsets: "Do older users have longer ses sions?"
When to use:
- De mographic analysis and comparison
- Understanding gender-based user experience differences
- Identifying outlier metrics
- Creating presentable comparative charts
⚙️ Advanced Features
Responsive Design Implementation
Mobile-First Approach:
- Ba se styles target small screens (< 480px)
- Breakpoints scale up from there
- Touch-friendly button sizes (minimum 44px × 44px)
- Vertical scrolling preferred over horizontal
Adaptive Layouts:
- In dividual View: Stacks vertically on mobile
- Trees reduce size but maintain proportions
- Summary and Charts: Center with max-width for readability
- Tooltips reposition to avoid screen edges
Real-Time Data Filtering
Filtering Architecture:
- No data recalculation → pure filtering of existing data
- New aggregations computed immediately
- Tree structure rebuilt with filtered data
- Radar chart dataset updated with new averages
Performance Considerations:
- CS V parse happens once at startup
- Filter operations are O(n) = fast even with large datasets
- Tree layout recalculation < 100ms
- Smooth visual transitions between states
Tooltip System
Smart Positioning:
- Ca lculated offset from cursor (10px right/below)
- Viewport boundary detection
- Automatic repositioning if would go off-screen
- Fixed positioning keeps tooltips visible during scroll
Content Adaptation:
- Di fferent tooltip formats for different elements
- Node tooltips: include type/context
- Metric tooltips: show actual values
- Icon tooltips: confirm demographic labels
- Center hotspot: comprehensive summary
🔍 Metrics Deep Dive
###:# Ra Agers)
Scale: Real-world ages from user population Me ning: Aver ge age of users in that demographic Im lications:
- Old er users (>50): May have different VR tolerance
- Younger users (<25): Likely more gaming experience
- Age differences by gender: Marketing targeting clues
- Age differences by device: User preference correlation
Example interpretation:
- Pla yStation VR female users average 45 years
- HTC Vive female users average 28 years
- PlayStation VR may attract different demographic
Motion Sickness (0-10 Scale)
Scale: 0 = No sickness, 10 = Severe nausea Me ning: Aver ge reported motion sickness level Im lications:
Sco re > 6: Significant usability issue
Score < 3: Device/content well-designed for comfort
Differences by gender: Women may report differently than men
Differences by device: Hardware/tracking quality matters
Correlation with duration: High sickness = shorter sess ions
Example interpretation:
- Pla yStation VR male users: 5.2/10 sickness
- HTC Vive male users: 3.1/10 sickness
- HTC Vive appears more comfortable for males
Duration (Minutes)
Scale: Session length from 0 to 60+ minutes Me ning: Aver ge VR session length before logout/break Implications:
- Lon ger duration = higher engagement/tolerance
- Shorter duration = content too intense or device unco mfortable
- Correlates with immersion: Immersed users stay longer
- May inverse-correlate with motion sickness: Sickness forc es exit
- Marketing proxy: Engagement metric
Example interpretation:
- Hig h immersion users stay 45 minutes on average
- Low immersion users stay 15 minutes on average
- 3x engagement difference suggests immersion quality matt ers
Immersion Level (0-5 Scale)
Scale: 0 = Not immersive, 5 = Completely immersive Meaning: User's subjective sense of presence in VR Implications:
- Sco re > 4: Excellent user experience
- Score < 2: Breaks sense of presence
- Correlates with duration: Immersed users stay longer
- May vary by content, not just hardware
- Key metric for VR effectiveness
Example interpretation:
- Pla yStation VR females: 3.8/5 immersion
- Oculus Rift females: 2.1/5 immersion
- PlayStation VR provides better female user immersion
🎯 Common Analysis Workflows
Workflow 1: Device Comparison
- Swi tch to Individual view
- Compare tree shapes for PlayStation VR vs HTC Vive vs Oculu s Rift
- Look for consistent patterns in motion sickness or durat ion
- Insight: Which device has the best user experience?
Workflow 2: Gender-Based Analysis
- Swi tch to Charts view
- Examine radar polygon shapes for each gender
- Look at icon counts to understand demographic breakdown
- Insight: Do different genders experience VR diffe rently?
Workflow 3: Demographic Targeting
- Use Summary view with specific headset combinations
- Check age ranges for each gender
- Combine with duration to understand engagement
- Insight: Which demographic is most engaged with which devic e?
Workflow 4: Troubleshooting User Experience
- Loo k for high motion sickness (> 6/10) in any category
- Compare duration for that group
- Check if immersion rating is also low
- Insight: Hardware/content causing discomfort needs fixin g
Workflow 5: Market Expansion
- Ana lyze which device/gender combination has lowest immer sion
- Consider it opportunity for improvement
- Check if motion sickness is related to low immersion
- Insight: Targeting this segment with better content could expand market
📱 Mobile Experience
Touch Interactions
- Hover effects replaced with tap/hold feedback
- Tooltips appear on tap, dismiss on tap elsewhere
- Buttons enlarged for touch targets (48px minimum)
- Scrolling enabled for long content
Screen Adaptations
- < 480 px: Single-column layout, stacked trees
- < 600px: Reduced font sizes, simplified spacing
- Full-width SVGs scale responsively
- Radar chart height reduced but maintains aspect ratio
Performance on Mobile
- Small er tree dimensions to reduce rendering load
- Tooltip positioned intelligently to avoid occlusion
- Canvas rendering optimized for tablet processors
- Touch events debounced to prevent double-triggers
🐛 Troubleshooting
Data Not Loading
- Issu e: CSV file not found
- Solution: Verify "Virtual Reality Experiences.csv" is in same directory as index.html
- Check: Browser console for 404 errors
Trees Not Rendering
- Issu e: SVG appears blank
- Solution: Wait for data to load (check browser network tab)
Check: Ensure browser supports ES6 modules (Chrome 63+)
Tooltips Appearing Offscreen
Issu e: Tooltips cut off at screen edges
Solution: This is auto-corrected, may need to move cursor
Check: Browser zoom level (try 100%)
Mobile Layout Issues
- Issu e: Trees overlapping or too narrow
- Solution: Rotate device to landscape for more space
- Check: Browser zoom reset to 100%
📞 Support & Questions
For technical issues:
- Check b rowser console (F12) for error messages
- Verify data file exists and is properly formatted
- Test in different browser
- Check that JavaScript is enabled
For data interpretation questions:
- Review "Metrics Deep Dive" section above
- Check "Interpretation tips" in Section-by-Section breakdow n
- Try filtering to test hypotheses
- Compare across multiple views for validation