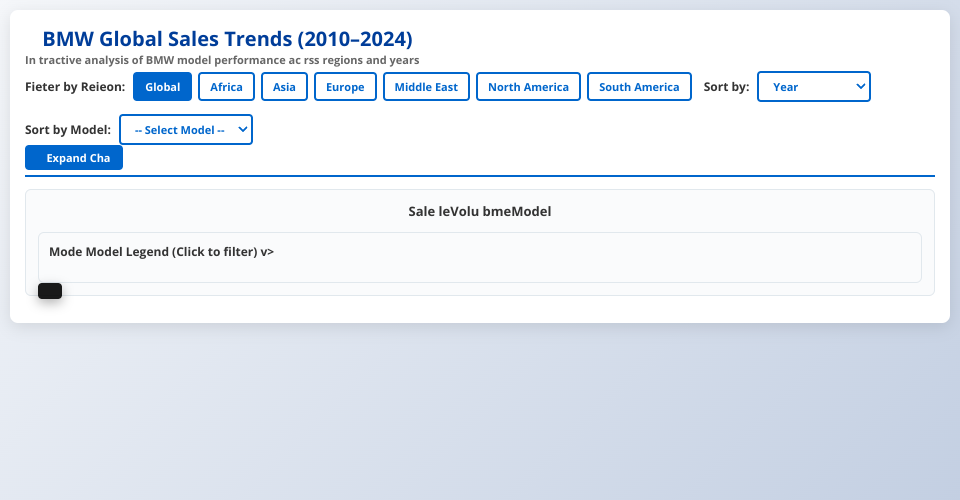
BMW Global Sales Trends Dashboard (2010–2024)
An interactive data visualization dashboard showing BMW model sales performance across different regions and years.
Features
Smooth Animations
- Bar heights and colors transition smoothly when switching regions or filters
- Animated transitions when sorting data
- Hover effects with smooth opacity changes
Interactive Filtering
- Region Filter: Click region buttons to filter data by geographic area
- Model Filter: Click any bar segment or legend item to highlight a specific model
- When a model is selected, other models are visually muted (reduced opacity)
- Clear filter option appears when a model is selected
Sorting Options
- Year: Default chronological order
- Total Sales: Sort bars by total sales volume (highest first)
- Alphabetical: Sort by year alphabetically
- By Model: Select a specific model to sort bars by that model's sales performance
Additional Features
- Responsive design that works on all screen sizes
- Expandable chart view for detailed analysis
- Interactive tooltips showing detailed sales information
- Legend with click-to-filter functionality
- Summary statistics cards
Usage
- Open
index.htmlin a modern web browser - Use region buttons to filter by geographic area
- Use sort dropdowns to reorder the bars
- Click on bar segments or legend items to highlight specific models
- Click "Expand Chart" for a larger view
- Hover over bars to see detailed information
Data
The dashboard visualizes BMW sales data from data.csv
including:
- Model names (3 Series, 5 Series, 7 Series, M3, M5, X1, X3, X5, X6, i3, i8)
- Years (2010-2024)
- Regions (Africa, Asia, Europe, Middle East, North America, South America)
- Sales volumes and classifications
MIT Licensed