BMW Global Sales Trends (2010–2024)
Overview
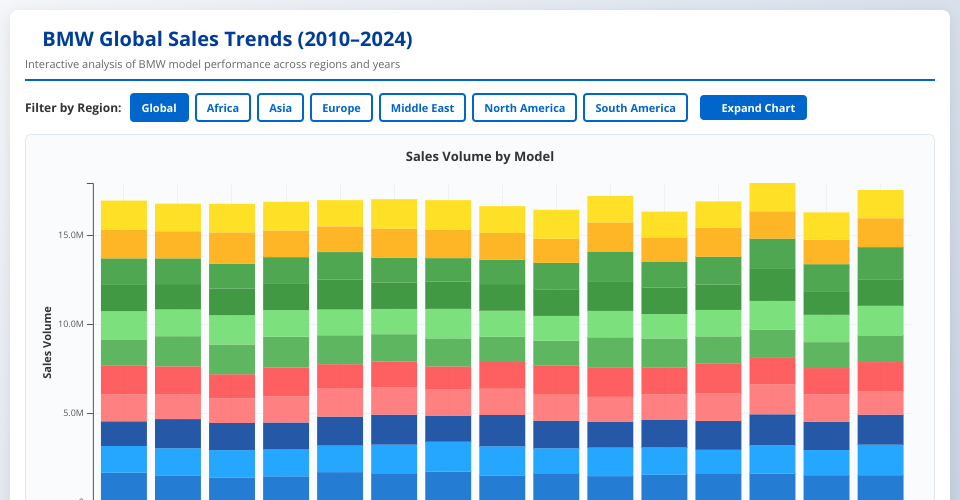
An interactive, professional dashboard visualizing BMW's global sales performance across 11 models over 14 years with dynamic region filtering and comprehensive analytics.
Features
📊 Stacked Bar Chart
- Chronological Layout: Sales data displayed from 2010 to 2024
- Model Breakdown: Each bar stacked by 11 BMW models (3 Series, 5 Series, 7 Series, M3, M5, X1, X3, X5, X6, i3, i8)
- Color-Coded Models: Distinct, harmonious colors for easy model identification
- Smooth Animations: Elegant transitions when switching regions
🌍 Region Filtering
- 7 Region Options: Global, Africa, Asia, Europe, Middle East, North America, South America
- Interactive Buttons: One-click region switching with visual feedback
- Real-time Updates: Chart, legend, and statistics update instantly
📈 Interactive Elements
- Hover Tooltips: Display year, model name, model-specific sales, and annual totals
- Expanded View: Click "🔍 Expand Chart" for a larger, more detailed visualization
- Modal Display: Expanded chart in a dedicated modal window for focused analysis
📋 Statistics Dashboard
- Total Sales: Aggregate sales for selected region
- Average Annual Sales: Mean sales per year
- Top Model: Best-performing model in the region
- Total Records: Count of all records
🎨 Design
- BMW-Themed: Blue and white color scheme reflecting BMW branding
- Responsive Layout: Optimized for laptop screens with readable fonts and spacing
- Professional Style: Clean, modern dashboard suitable for analytics presentations
- Mobile-Friendly: Responsive design adapts to smaller screens
Data Structure
The visualization uses the following data fields:
- Model: BMW model name
- Year: Sales year (2010–2024)
- Region: Geographic region
- Sales_Volume: Number of units sold
Technical Stack
- D3.js v7: Data visualization and interactive elements
- HTML5: Semantic markup
- CSS3: Modern styling with flexbox and grid
- JavaScript ES6: Interactive functionality
How to Use
- View Global Data: Dashboard loads with global sales data by default
- Filter by Region: Click any region button to update the visualization
- Explore Details: Hover over bars to see detailed sales information
- Expand View: Click "🔍 Expand Chart" for a larger visualization
- Analyze Trends: Use the statistics cards to compare regions
- Review Legend: Check the legend to identify models by color
Key Insights
The dashboard enables analysis of:
- Which models drove sales growth over time
- Regional performance differences
- Model momentum shifts year-to-year
- Peak sales periods and trends
- Comparative regional performance
Browser Compatibility
- Chrome (recommended)
- Firefox
- Safari
- Edge
Files
index.html- Main dashboard structure and stylingscript.js- D3.js visualization and interactivity logicdata.csv- BMW sales datasetREADME.md- Documentation
Future Enhancements
- Export functionality (PNG, CSV)
- Year range slider for focused analysis
- Model-specific filtering
- Trend line analysis
- Year-over-year growth rates
- Custom color themes
MIT Licensed