Data Visualization Studios Around the World
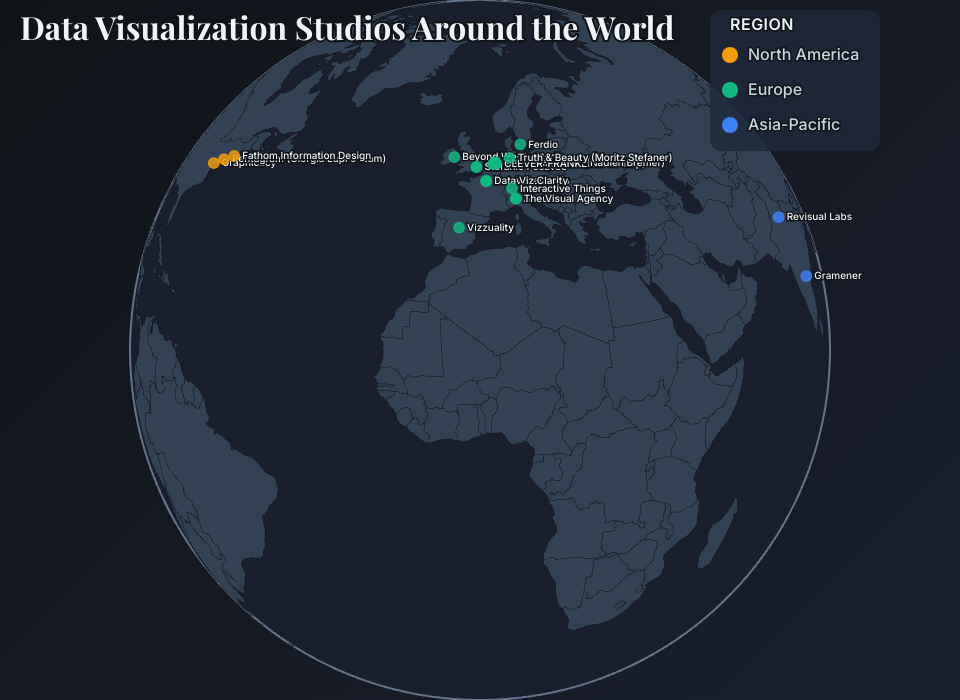
An animated spinning globe visualization showing data visualization studios and their locations across the globe using an Orthographic projection.
This visualization uses the Orthographic projection from D3, which projects the globe onto a flat plane, creating a view of the Earth as if looking at it from space. The globe continuously rotates to show different regions of the world over time.
Features
- Spinning Globe: Continuously rotating orthographic projection for an immersive view
- Orthographic Projection: Perspective projection that simulates viewing the Earth from space
- Data Points: Studios projected onto the map based on latitude/longitude
- Color-Coded Regions: Visualized by region (North America, Europe, Asia-Pacific)
- Interactive Legend: Hover over regions to highlight related studios
- Responsive Design: Adapts to different screen sizes with smooth animations
Interactions
- Hover Legend: Hover over regions in the legend to highlight and emphasize related studios on the spinning globe
Projection
This visualization uses the geoOrthographic projection
from d3-geo, which projects
the globe onto a flat plane as if viewing it from infinite
distance in a particular direction. This creates a realistic
appearance similar to viewing the Earth from space. The
globe continuously rotates around the vertical axis to
display different longitudes while maintaining a fixed
latitude tilt.
Data
Data sourced from publicly available information about data visualization studios worldwide, including studio names, locations, regions, and contact information.