Survey Visualization
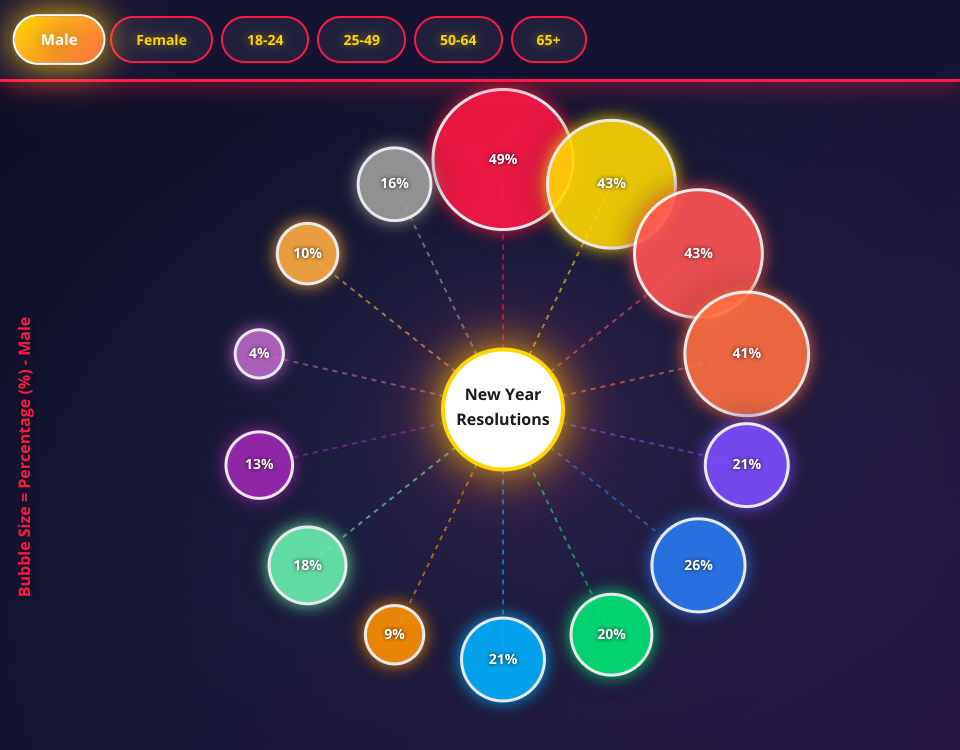
A D3.js + React visualization of survey data showing responses by demographic categories (gender and age groups).
Features
- Interactive bubble chart showing response percentages
- Toggle between demographic categories (Male, Female, age groups)
- Responsive design that adapts to container size
- Click bubbles to highlight selections
- Orbital visualization with center hub
Data
The visualization displays survey responses across 6 demographic categories:
- Gender: Male, Female
- Age Groups: 18-24, 25-49, 50-64, 65+
MIT Licensed