Interactive Dashboard
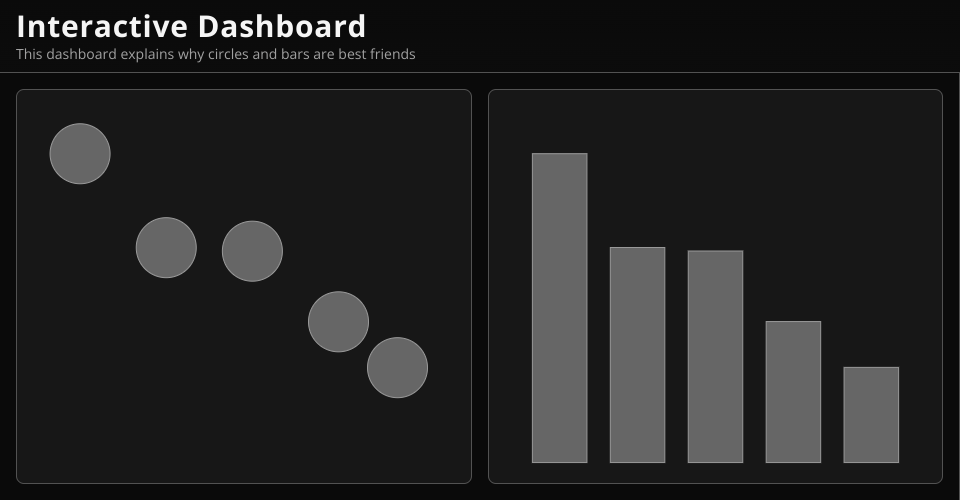
A modern, interactive dashboard application built with React and D3.js, featuring dual synchronized charts (scatter plot and bar chart) with a grayscale theme and professional styling.
Features
- Dual Interactive Charts:
- Scatter plot with clickable circles
- Bar chart with synchronized selection
- Charts update reactively based on user interactions
- Synchronized Selection: Click on elements in either chart to select them; click again to deselect
- Responsive Design: Charts automatically resize to fit their containers using ResizeObserver
- D3 Integration: Leverages D3.js scales and selections for data visualization
- Grayscale Theme: Professional grayscale color palette with dark gradient background
- Hover Effects: Visual feedback with brightness transitions on hover
Architecture
Components
- App: Main application component that manages shared selection state
- Layout: High-level layout wrapper with header and main content sections
- HeaderTitleTagline: Reusable header component with title and subtitle
- LayoutMainContent: Flexible main content container
- Viz: Generic chart container that handles SVG rendering and dimension tracking
- ScatterPlot: Scatter plot component (renders circles)
- BarChart: Bar chart component (renders bars)
Utilities
- useChartDimensions: Custom hook that uses ResizeObserver to track container dimensions
- chartConfig.js: Centralized configuration for colors and padding
- chartUtils.js: Shared D3 utilities for styling and interactions
- renderCircles.js: D3 rendering function for scatter plot
- renderBars.js: D3 rendering function for bar chart
Data
The application uses sample data defined in data.js
containing 5 data points with:
id: Unique identifierx: X-axis value (0-960 range)y: Y-axis value (0-500 range)
Color Scheme
- Primary: #666666 (Medium Gray) - Default element color
- Selected: #ffffff (White) - Highlighted element color
- Accent: #cccccc (Light Gray) - Selected element stroke
- Background: Grayscale gradient from #1a1a1a to #2d2d2d
Getting Started
- Open
index.htmlin a modern browser (uses ES modules) - The application loads React, React-DOM, and D3 from CDN
- Styling is powered by Tailwind CSS and custom theme variables
Interaction
- Click on circles or bars to select/deselect them
- Hover over elements for visual brightness feedback
- Click on SVG background to deselect all elements
- Selection state is synchronized across both charts
Tech Stack
- React 19: UI framework
- D3 7: Data visualization
- Tailwind CSS 4: Utility-first CSS framework
- ES Modules: Modern JavaScript module system
MIT Licensed