Music Format Evolution Chart
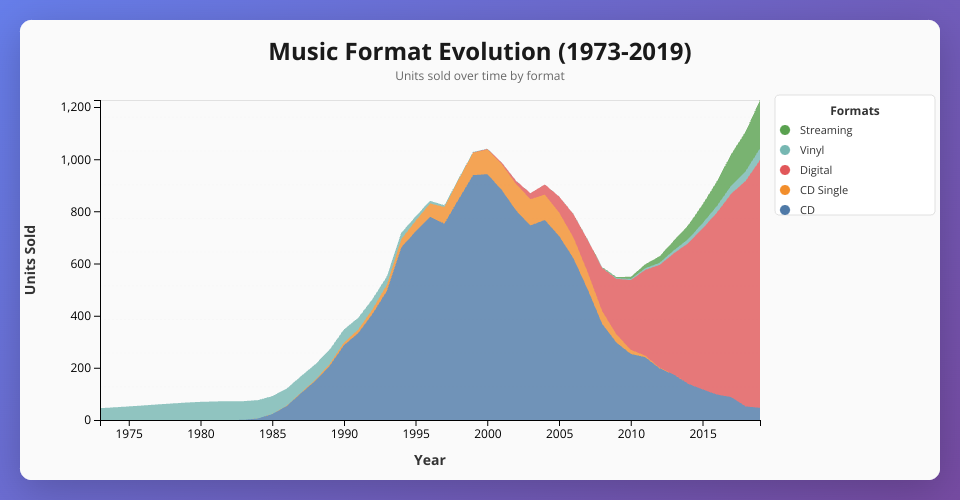
An interactive stacked area chart visualizing the evolution of music formats from 1973 to 2019.
Features
- 📊 Stacked Area Chart: Visualizes multiple music formats over time
- 🎨 Interactive Visualization: Hover over areas to highlight specific formats
- 📱 Responsive Design: Adapts to different screen sizes
- ✨ Smooth Animations: Animated area transitions on load
- 🎯 Legend Interaction: Click legend items to focus on specific formats
- 🌈 Color-coded: Each format has a distinct color for easy identification
Data
The chart displays data from data.csv showing units sold
for various music formats (CD, CD Single, etc.) from 1973
to 2019.
Technologies
- React 19
- D3.js 7
- CSS3
How to Use
- The chart automatically loads and parses the CSV data
- Hover over areas to highlight specific formats
- Click on legend items to focus on that format
- The chart is fully responsive and resizes with the window
Data Format
The CSV file should include:
Format: Music format type (e.g., CD, CD Single)Year: Year of dataValue (Actual): Units sold (European decimal format with comma)
MIT Licensed