BMW Sales Visualization
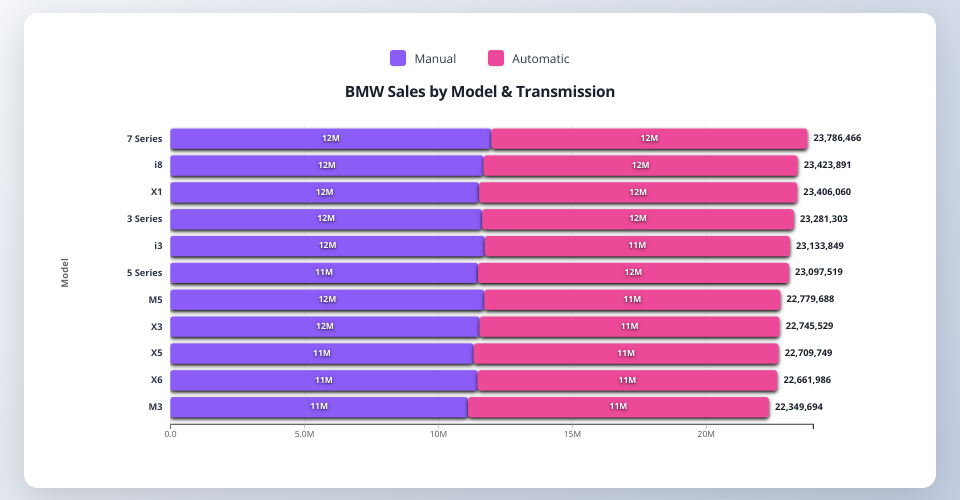
An interactive D3.js horizontal stacked bar chart visualizing BMW sales data by model and transmission type.
Features
- Stacked Bar Chart: Shows sales volume for Manual vs Automatic transmissions by BMW model
- Interactive Tooltips: Hover over bars to see detailed sales information
- Responsive Design: Adapts to different screen sizes with a modern gradient background
- Visual Polish: Smooth animations, drop shadows, and hover effects
Data
The visualization uses data.csv containing BMW sales
records with the following columns:
- Model: BMW model (3 Series, 5 Series, 7 Series, X1, X3, X5, X6, M3, M5, i3, i8)
- Year: Production year
- Region: Geographic region
- Color: Vehicle color
- Fuel_Type: Petrol, Diesel, Hybrid, or Electric
- Transmission: Manual or Automatic
- Engine_Size_L: Engine displacement in liters
- Mileage_KM: Odometer reading in kilometers
- Price_USD: Sale price in USD
- Sales_Volume: Number of units sold
- Sales_Classification: High or Low sales category
Visualization
The chart aggregates sales volumes by:
- Y-Axis: BMW Model names
- X-Axis: Total Sales Volume (in millions)
- Colors:
- Purple (#8B5CF6): Manual transmission
- Pink (#EC4899): Automatic transmission
Models are sorted by total sales volume in descending order.
Files
index.html- HTML structure and stylingscript.js- D3.js visualization logicdata.csv- BMW sales dataset
Technologies
- D3.js v7 - Data visualization
- HTML5 - Structure
- CSS3 - Styling with gradients and animations
Usage
- Open
index.htmlin a modern web browser - Hover over bars to see detailed sales information
- Data is automatically loaded from
data.csv
Interaction
- Hover: Bars brighten and scale slightly, showing a tooltip with model, transmission type, and sales volume
- Visual Feedback: Drop shadows and smooth transitions provide responsive feedback
MIT Licensed