Assistive Technology Education Programs - World Map
Description
Interactive world map and visualization showing the availability and characteristics of assistive-technology education programs by WHO region and training content type. This visualization makes it easy to explore regional access to assistive technology training programs globally and understand the distribution of training focus areas.
Source: Kaggle — Availability of Education for
Assistive Technology by yapwh1208
Link: https://www.kaggle.com/datasets/yapwh1208/availability-of-education-for-assistive-technology
Visualization Features
Programs by WHO Region Table
- Continent grouping: Countries are organized by continent with total program counts
- Region breakdown: Each WHO region is listed with its total program count
- Color-coded continents: Visual distinction between Africa, Americas, Asia, Europe, and Oceania
- Sorted by totals: Regions with more programs appear first for quick identification
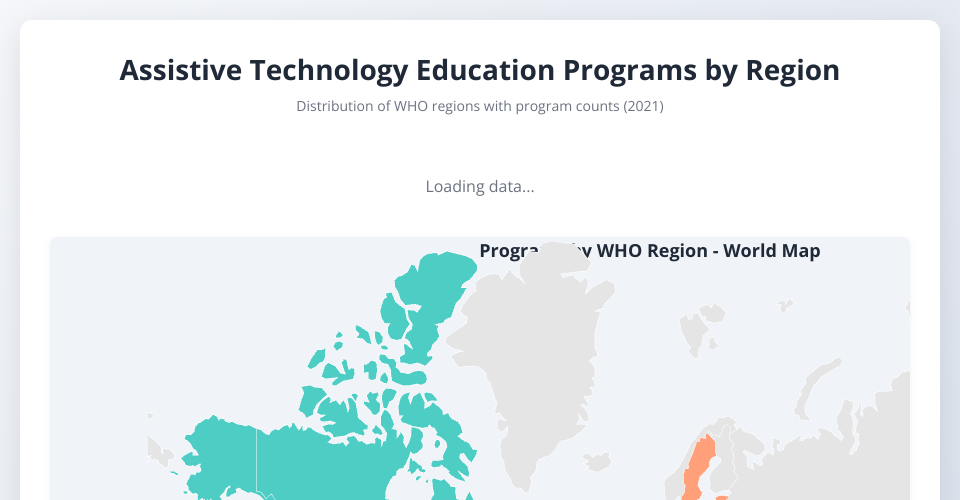
Interactive World Map
- Color-coded regions: Countries are colored by WHO
region, with distinct colors for each region:
- Africa (Red)
- Americas (Teal)
- Eastern Mediterranean (Blue)
- Europe (Light Coral)
- South-East Asia (Mint)
- Western Pacific (Yellow)
- Hover details: Mouse over any country to see:
- Region name
- Total programs in that region
- Breakdown by training content type (Cognition, Communication, Hearing, Mobility, Self-care, Vision)
- Geographic context: Easily identify regional patterns and gaps in assistive technology education
- Gray countries: Indicate no data available for that country
Stacked Bar Chart
- Regional comparison: Shows all WHO regions with programs
- Content type breakdown: Each bar is stacked by training content type
- Color-coded types: Different colors represent different training focuses
- Interactive bars: Hover over any segment to see the region and specific content type count
Filter by Training Content Type
- Dropdown selector: Filter visualizations by specific training categories
- Dynamic updates: Map and bar chart update to show filtered data
- All content types: Option to view complete dataset without filtering
Legends
- Training Content Types Legend: Shows all content types with their assigned colors
- Region Totals Legend: Shows each region with color coding and total program count
Data Attributes
- Location — Country name (nominal). Geographic area of the record.
- Period — Year of data collection (temporal). Data is from 2021.
- ParentLocationCode — WHO region code (nominal). AFR, EUR, AMR, EMR, WPR, SEAR
- ParentLocation — WHO region name (nominal). Africa, Europe, Americas, Eastern Mediterranean, Western Pacific, South-East Asia
- Dim1 — Type of assistive technology training
(nominal). Includes:
- Training related to Cognition
- Training related to Communication
- Training related to Hearing
- Training related to Mobility
- Training related to Self-care
- Training related to Vision
How to Use
- Load the CSV file:
Education for assistive technology.csv - Open
index.htmlin a web browser - Review the table: Check the "Programs by WHO Region" table for an overview of program distribution by continent
- Explore the world map: Hover over countries to see region details and content breakdown
- Filter by content type: Use the dropdown selector to focus on specific training categories
- View the bar chart: Compare content distribution across regions with visual stacked bars
- Check the legends: Understand color coding and program counts for all regions and content types
Technologies Used
- D3.js v7.6.1 — Data visualization and interactive features
- TopoJSON — Geographic data format for country boundaries
- World Atlas — Country boundary data at 110m resolution
- CSS3 — Responsive styling and animations
Data Processing
- Programs are aggregated by WHO region and training content type
- Content type names are normalized from truncated CSV values
- Countries are colored by their parent WHO region
- Total program count per region determines color intensity and sorting
- Stacked bars show content type composition for each region
- Continent grouping organizes data hierarchically
- Data period: 2021
File Structure
MIT Licensed