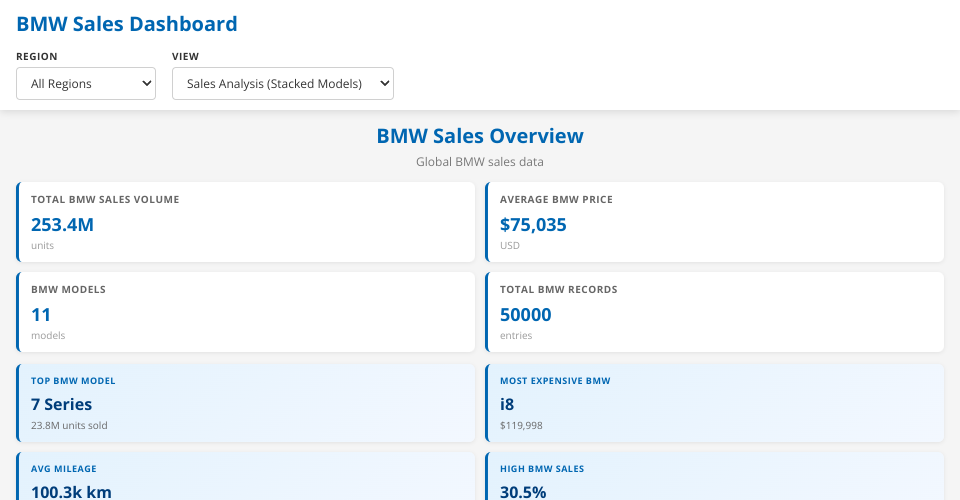
BMW Sales Dashboard
A responsive, interactive data visualization dashboard built with D3.js for analyzing BMW vehicle sales data.
Features
- Responsive Design: Optimized for laptop (1366px+), tablet (768px-1200px), and mobile (<768px)
- Dynamic View Switching: Toggle between 6 different visualization types
- Region Filtering: Filter data by specific regions or view global overview
- Summary Cards: Quick metrics including total BMW sales, average price, and more
- Insight Cards: Key performance indicators and statistical insights
- Interactive Charts: Hover tooltips with clear positioning, smooth transitions, and legend interactions
- Magnifiable Charts: Click any chart to open an enlarged version in a modal overlay
- Yearly Trend Analysis: All data aggregated and displayed by year for comprehensive BMW sales trends
- Clean Layout: No overlapping elements, proper spacing throughout
Available Views
- Sales Analysis (Stacked Models) - Stacked bar chart showing BMW sales by model per year
- Sales Trend by Region - Line chart tracking regional BMW sales trends over years
- Average Price Over Time - Area chart showing average BMW vehicle prices by year
- Sales by Region (Bar) - Horizontal comparison of BMW sales across regions
- High vs Low Price Share (Donut) - Donut chart showing BMW sales classification distribution
- Sales by Model (Horizontal Bars) - Top 10 BMW models ranked by sales volume
Getting Started
- Place
data.csv,index.html, andscript.jsin the same directory - Open
index.htmlin a modern web browser - Use the dropdown filters to select region and visualization type
- Hover over chart elements for detailed tooltips
- Click any chart to open a magnified view with enhanced readability
File Structure
index.html- Main dashboard markup and stylingscript.js- D3.js visualization logic and data processingdata.csv- BMW sales data sourceREADME.md- Documentation
Requirements
- Modern web browser (Chrome, Firefox, Safari, Edge)
- D3.js v7 (loaded via CDN)
- Local web server recommended for serving CSV file (optional for many browsers)
Responsive Breakpoints
- Desktop (≥1200px): Full layout with optimized spacing
- Tablet (768px-1200px): Two-column grid layout
- Mobile (<768px): Single-column layout with stacked filters
- Small Mobile (<480px): Compact view with adjusted font sizes
Key Features & Improvements
✓ All "YTD" labels replaced with "BMW" ✓ "Weekly" analysis changed to "Yearly" for all charts ✓ Data aggregated by year instead of by week ✓ Magnifiable charts - click to open enlarged modal view ✓ Enhanced tooltips in magnified view ✓ Smooth modal open/close animations ✓ Keyboard support (ESC to close modal) ✓ Fixed overlapping header elements ✓ Improved tooltip positioning with boundary checking ✓ Better grid layout with auto-fit columns ✓ Cleaner visual hierarchy and spacing ✓ Enhanced legend readability ✓ Consistent typography and colors ✓ Better touch targets on mobile devices ✓ Improved accessibility throughout
Modal Features
- Click any dashboard chart to magnify it
- Use keyboard (ESC) or click close button to dismiss
- Full interactivity maintained in magnified view
- Tooltips remain fully functional
- Responsive design adapts to different screen sizes
- Smooth transitions and consistent styling
MIT Licensed