Public vizzes
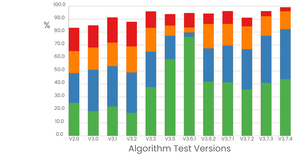
Algorithm Results Evaluation

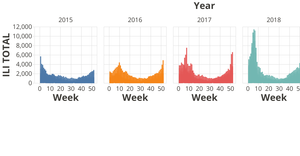
ILINet Flu Surveillance Data Interactive Visualization

Stacked Algorithm Results Evaluation
Algorithm Results Evaluation

ILINet Flu Surveillance Data Interactive Visualization

ILINet Flu Surveillance Data Interactive Visualization

ILINet Flu Surveillance Data Interactive Visualization

ILINet Flu Surveillance Data Interactive Visualization

ILINet Flu Surveillance Data Interactive Visualization

ILINet Flu Surveillance Data Interactive Visualization
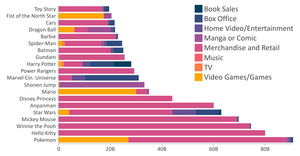
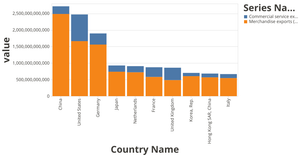
Stacked Franchise Revenues by Revenue Category

ILINet Flu Surveillance Data Interactive Visualization

Interactive Scatter Plot for Boston Housing Dataset
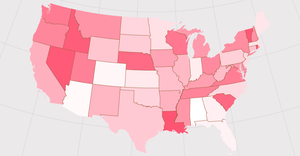
Outbreaks in United States
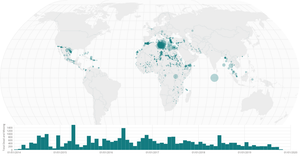
Multiple Views with Brushing

ILINet Flu Surveillance Data Interactive Visualization

ILINet Flu Surveillance Data Interactive Visualization
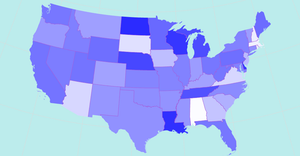
Centered US Map
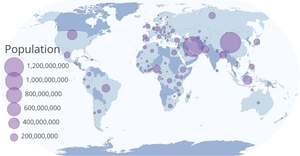
World Happiness Scores by Population

ILINet Flu Surveillance Data Interactive Visualization

Line Chart for ILINet Flu Surveillance Data

Multiple Views Cleanup
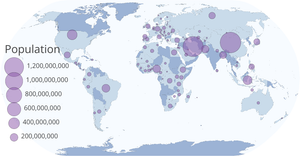
World Happiness Scores by Population
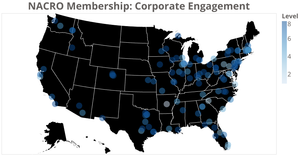
NACRO Membership: Corporate Engagement
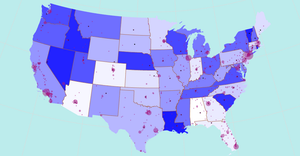
US Choropleths Map And Captital/Major Cities

Centered US Map

Line Chart for ILINet Flu Surveillance Data
Rendering Data with React
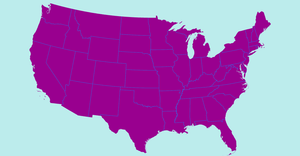
Centered US Choropleths Map
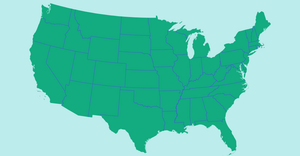
Centered US Map

Line Chart for ILINet Flu Surveillance Data

Line Chart for ILINet Flu Surveillance Data
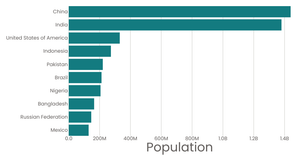
Stylized Bar Chart
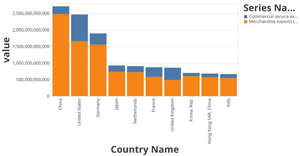
Top 10 States in 2018
Top 10 States in 2018

Line Chart for ILINet Flu Surveillance Data

Polished Scatter Plot with Menus

Scatter Plot with Menu for ILINet Flu Surveillance Data

Scatter Plot with Menus for Boston Housing Dataset
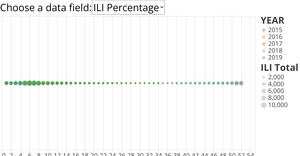
ILINet Flu Surveillance Data
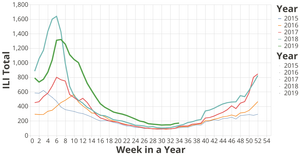
ILINet Flu Surveillance Data
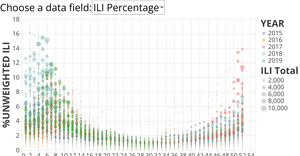
ILINet Flu Surveillance Data

Polished Scatter Plot with Menus
Menus with React

Rotating Disks

Hello React!

Movie Counts by IMDB Rating
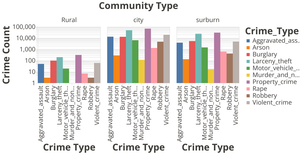
Massachusetts City Population by Burglary

Vega-Lite API Template

Vega-Lite US Map Unemployment
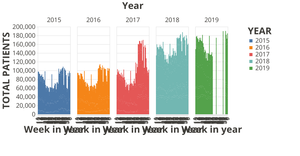
ILINet Flu Surveillance Data

Vega-Lite API Choropleths Maps Table Row

Vega-Lite US Maps With Captital Cities

Vega-Lite US Map for Unemployment Rate

Vega-Lite Choropleths Maps Table Column
Housing Values At Boston Suburbs
ILINet Flu Surveillance Data

Smiley Face Part III

Smiley Face Part I

Smiley Face Part II
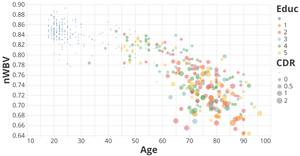
MRI and Alzheimers Data
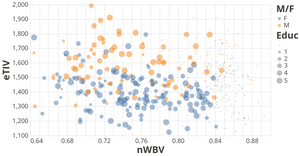
MRI and Alzheimers Data
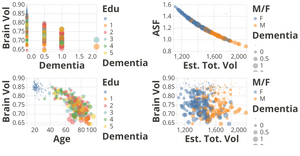
MRI and Alzheimers Data
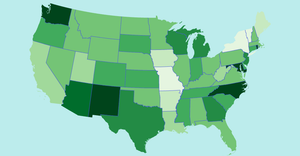
Centered US Map

Centered US Map
Centered US Map
Centered US Map
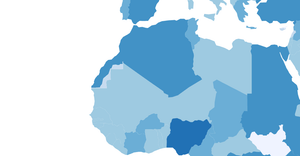
Centered US Map

Centered US Map

US Choropleths Map
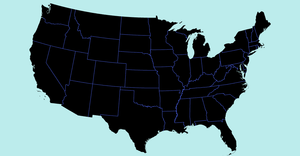
Centered US Map
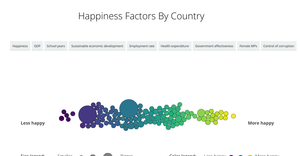
Happiness Factors Comparison by Country

Centered US Map

Making a Bar Chart Part e.g.1
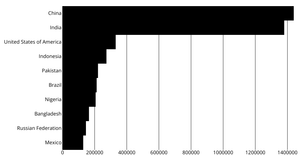
Refactored Bar Chart
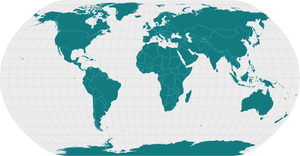
Polished World Map
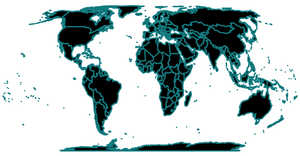
World Map First Pass
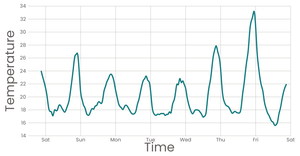
Line Chart

Rendering Data with React

Mouse Follower

Housing Values At Boston Suburbs

Vega-Lite US Maps With Capital Cities
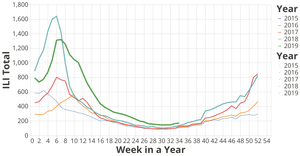
ILINet Flu Surveillance Data
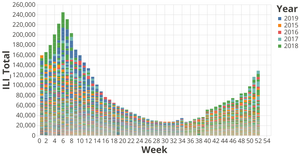
ILINet Flu Surveillance Data
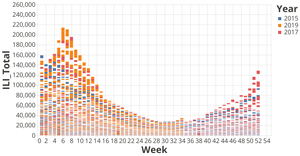
ILINet Flu Surveillance Data
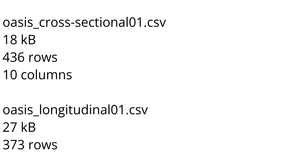
MRI and Alzheimers Data
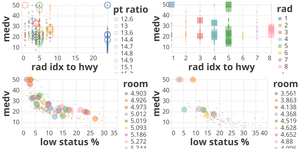
Boston Housing Dataset Part II
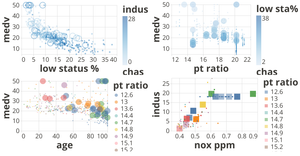
Boston Housing Dataset Part I
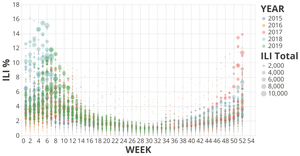
ILINet Flu Surveillance Data
