A visualization constructed using the vega-lite-api.
In this MIR and Alzheimers dataset, we mainly look at the data table in file: oasis_cross-sectional01.csv
The important fields are:
- nWBV – Normalized Brain Volume
- CDR – Dementia
- Educ – Education
- M/F and Age – Patient info
- eTIV – Estimated Total Intracranial Volume
- ASF – Atlas Scaling Factor
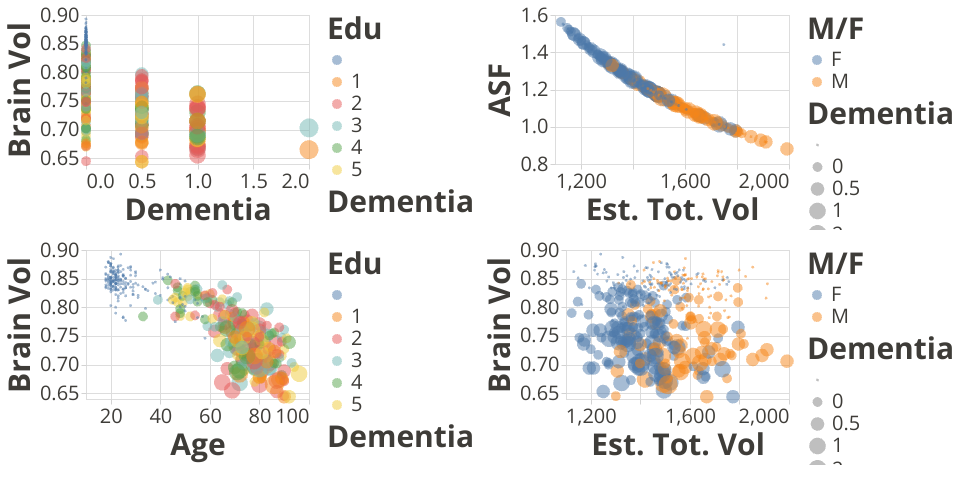
In this page, we visualize dataset01 using 4 plots:
- Plot01 shows the distribution value of CDR for dementia. The dementia case corresponds to smaller brain volume, but the variation for bain volume is also big for healthy people.
- eTIV and ASF shows a non-linear but fixed relationship. This makes sense in that these two variables are both obtained through analyzing the same MRI image, and they have inverse relationship.
- When bringing patient age into the picture, we can tell that dementia happens in older population. But the pattern is not obvious when related to education level.
- When we switch color channel to denote gender, they seems to have a good separation according to the eTIV field. Given the distribution of normalized brain volume between male and female are the same from the plot. It seems to indicate that the original estimation, likely without normalization, the dTIV values are generally larger for male than female. The size channel shows the same information above: CDR corresponding to lower brain volumes.
See Data on Gist: MRI and Alzheimers
The original data comes from the Open Access Series of Imaging Studies (OASIS)
MIT Licensed