A visualization constructed using the vega-lite-api.
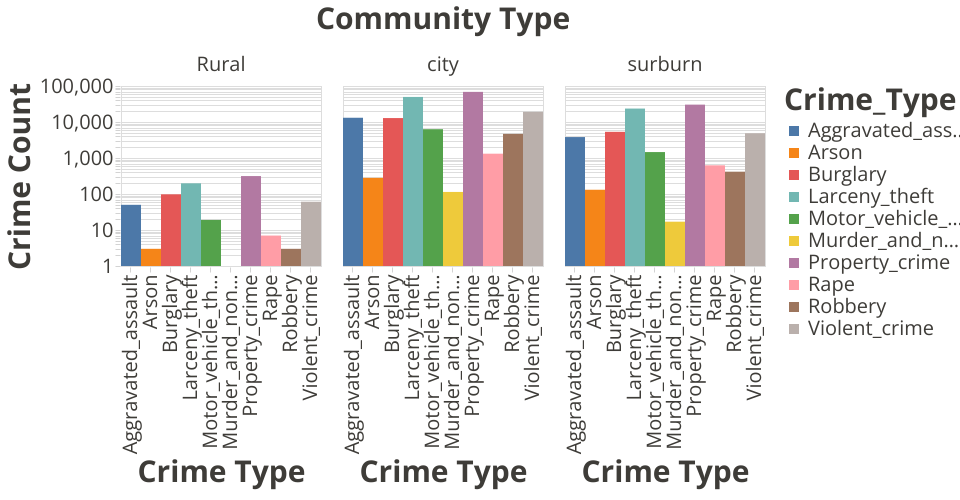
Crime dataset is unpivot and reloaded in gist repository. This is used to visualize crime distribution in different community. Notice that the log scale is used in Y axis, as the value differences are really huge.
The Massachusetts crime data used here is available on the Gist.
MIT Licensed