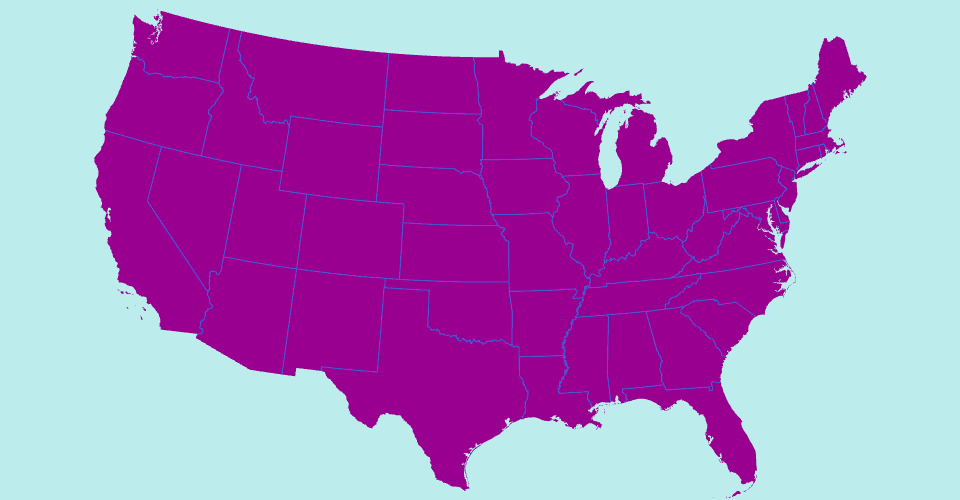
A US map showing states boundaries from US Atlas TopoJSON.
This visualization is the attempt to use the d3 and React tools we learned from the class to draw US states choroplehs map. The input value is a stateRate.tsv data in additional to TopoJson map data.
The problems solved in this work are:
- a) Find and switch to the US topoJson data and apply correct projection.
- b) Load multiple data files into data for use. Here is the useful resource I found to Load Multiple Files
- c) Set filled color in Marks function. Because there is no proper examples for it, I reviewed many references (see attached) and tried multiple ways, only the first color mapping seems working. The look up table method has some array accessing issue, and using React Component class derivation failed to work with current data loading code.
- d) Adjusted various colors and defined other styles when necessary.
In summary, it is a great learning experience, yet a lot of unknowns. Its clear that React code and previous d3 examples have pretty big gaps that cannot be transfered easily. I also realized the facts that different tools are not very easily to co-exist and they are also evolving fast. All such knowledges can only be abtained when we really get our hands dirty and try different ways to solve the same problem.
References:
- World Population Map, using color scale map method.
- India Map using GeoJSON, using color look-up table/array method.
- US Map for general data table, using React Component classes.
MIT Licensed