
0 views in last 90 days
aishwarya8615
@aishwarya8615
Public vizzes

Globe Zoom - Animate

Smiley Face Part II
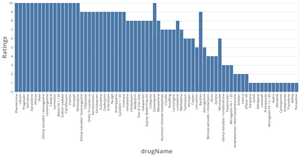
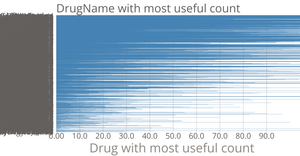
Top Drugs in each rating
Drug Vs Rating
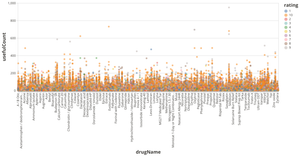
Interactive Color Legend Scatterplot to determine Useful Count of rating per year
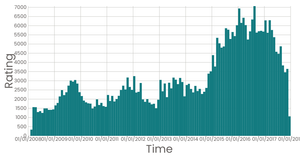
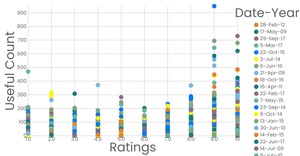
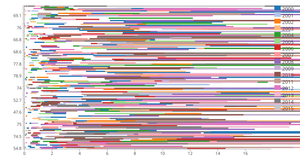
Drug Ratings Date Histogram
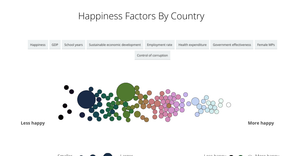
Happiness Factors Comparison by Country
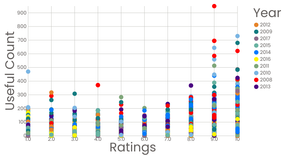
Interactive Color Legend Scatterplot to determine Useful Count of rating per year

Excited face

Color CD with React & D3
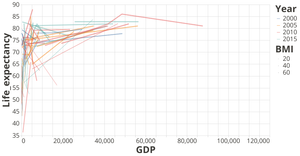
Line Diagram of World Life Expectancy with respect to GDP
Interactive Color Legend Bar chart with tooltip for Alcohol Vs Life Expectancy
Interactive Legend Bar chart for Alcohol Vs Life Expectancy

ILINet Flu Surveillance Data Interactive Visualization
Customizing Axes

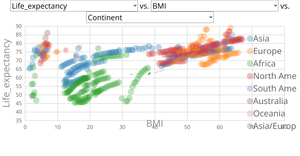
Interactive Color Legend Scatter Plot for Life Expectancy Data with Menu for Mortality
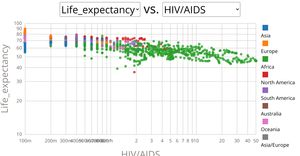
Interactive Color Legends with informative Tooltips and dropdown menu

Interactive Color Legend Scatter Plot for Life Expectancy Data with Menu
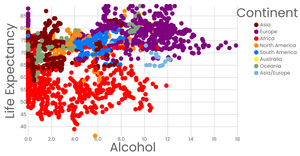
Interactive Color Legend Scatterplot to determine Alcohol consumption Vs Life Expectancy

Interactive Color Legend Scatter Plot for Health Expenditure Vs Life Expectancy
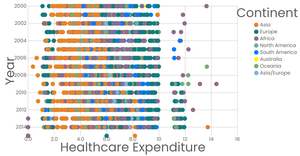
Interactive Color Legend Scatterplot to determine Healthcare Expenditure per year

Polished Scatter Plot with Menus_Life Expectancy Data
Scatter Plot with Color Menu for Life Expectancy Data
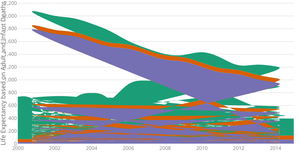
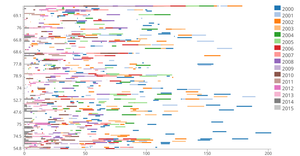
Area Chart with Life Expectancy, Adult and Infant Deaths
Scatter Plot of World Life Expectancy Yearwise
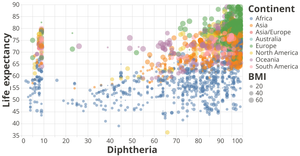
Scatter Plot of World Life Expectancy considering Diphtheria vaccination administration
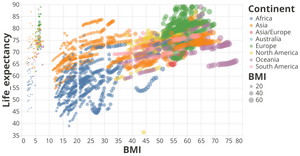
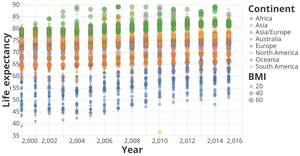
Scatter Plot of World Life Expectancy Data based on BMI
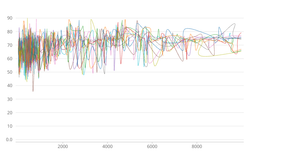
Multi Line Plot of Life Expectancy with respect to GDP
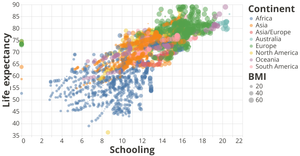
Scatter Plot of World Life Expectancy Data versus Education

Loading and Parsing Healthcare Dataset Stroke CSV Data

Loading and Parsing US Minimum Wage by State from 1968 to 2017 and 2018 Equivalent Dollars CSV Data

Loading and Parsing Life Expectancy CSV Data

Changing Colors with Waves
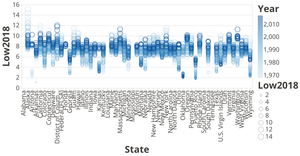
Scatter plot showing Statewise Minimum Wage
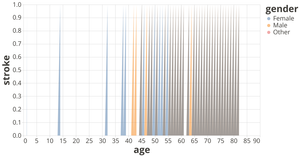
Area Plot displaying Stroke Prediction based on age

Loading and Parsing US Minimum Wage by State from 1968 to 2017 and 2018 Equivalent Dollars CSV Data

Line Plot of Life Expectancy Data_GDPVsLifeExpectancy

Life Expectancy Vs GDP Chart

Hello HTML

Smiley Face Part II

Smiley Face Part II

Smiley Face Part II

Smiley Face Part II

Smiley Face Part II

Smiley Face Part II

Smiley Face Part II
Smiley Face Part II