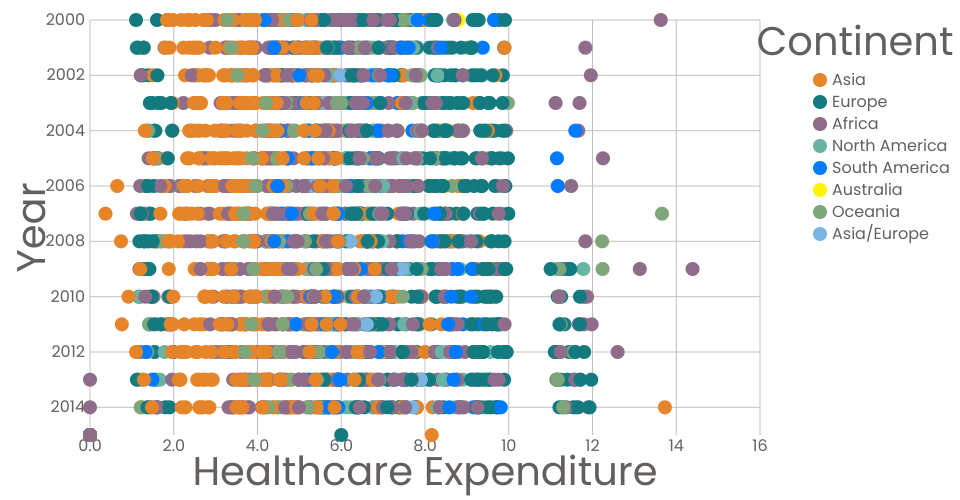
An Interactive Color Legend Scatter plot for Life Expectancy Data.
This scatterplot takes required inputs from the data(like Health Expenditure, Year and Continent) and uses these as inputs to both X and Y axes with the help of an Interactive Color Legend using 'Continent' as input. This scatter plot would help in determining the healthcare expenditure per year in various continents.
Note: I got some ideas about the interactive color legend from Prof. Curran's Interactive Color Legend
MIT Licensed