Minimum Wage Data:
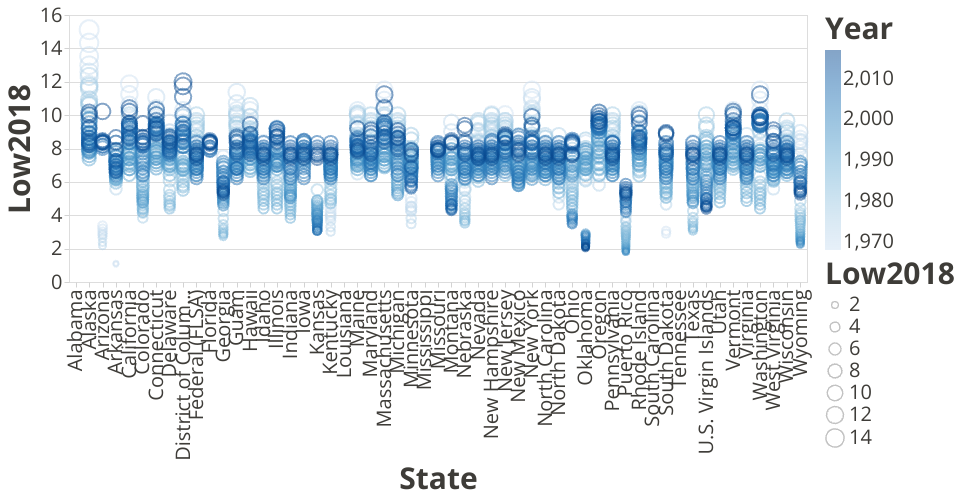
Dataset Source: Data used is US Minimum Wage Data The Scatter Plot uses vega-lite-api and helps in visualizing the minimum wage prevailing in all the states in USA.
This visualization plot shows the minimum wage that prevailed in different states in USA from 1968 to 2017.The size of the points is based on the minimum wage value and the interesting part is that it started from $1. The tooltip displays the states.We also have the Federal Low Wage plotted to view the low wage mentioned by Federal government.
Analysis: The Federal suggested Low wage appears to be an average value of all the states combined.
Note: The template was forked from Vega-Lite-API Template
MIT Licensed