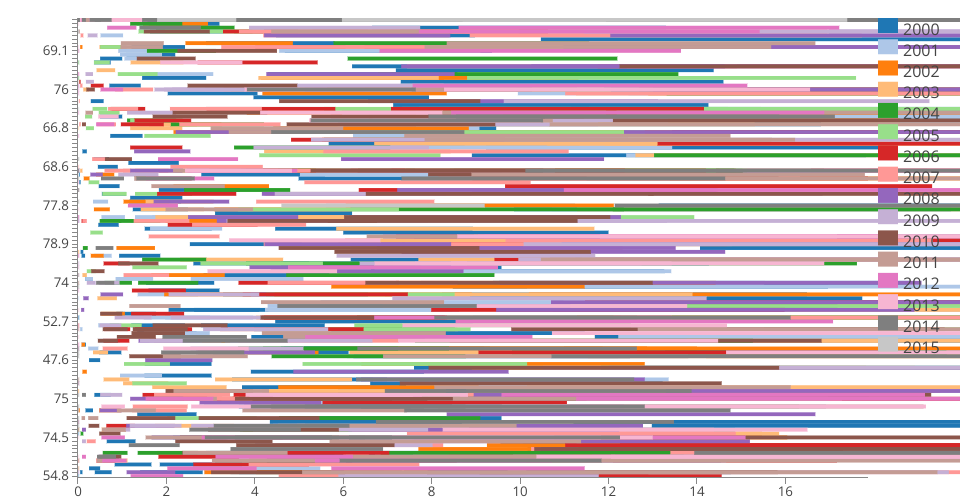
An Interactive Color Legend bar chart for Life Expectancy Data.
This bar chart takes required inputs from the data(like Alcohol Consumption, Life Expectancy and Year) and uses these as inputs to both X and Y axes with the help of an Interactive Color Legend using 'Year' as input. This scatter plot would help in determining the relationship between Alcohol Consumption and Life Expectancy in various continents.
Note: Skeleton of the code forked from Religions of Largest 20 Countries
MIT Licensed