Public vizzes
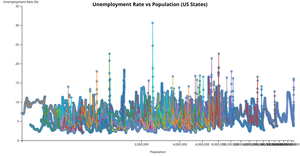
Unemployment Rate vs Population Scatter Plot
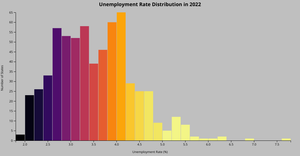
US Unemployment Rate Histogram
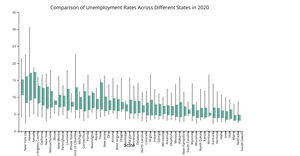
Unemployment Rate Box Plot
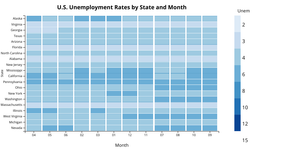
Unemployment Rate Heatmap
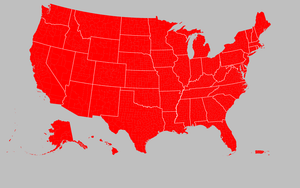
Fork of Choropleth with Histogram Brushing
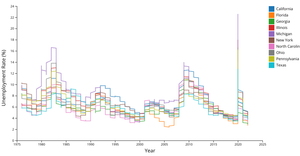
Fork of Line Chart with Multiple Lines Unemployment Rates Comparison
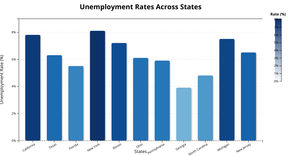
Bar Chart: Unemployment Rates by State
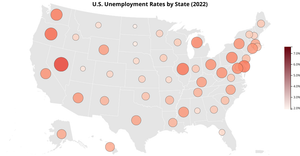
US Unemployment Bubble Map
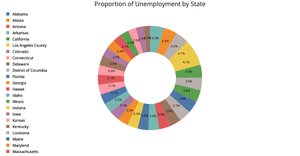
Pie Chart unemployment across various U.S. states.
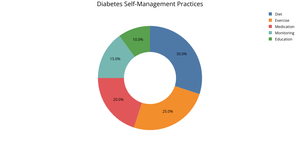
Fork of Diabetes Self-Management Practices Pie Chart
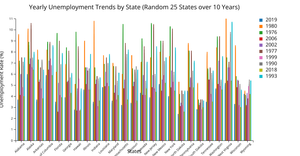
Fork of Bar Chart: the unemployment rates for 25 random states over 10 years
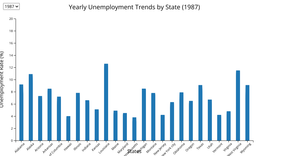
Fork of Bar Chart: the unemployment rates for 25 random states over 10 years with a dropDown
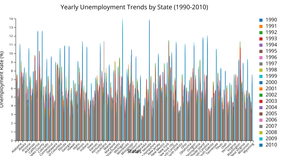
Fork of Bar Chart: the unemployment rates for each state from 1990 to 2010
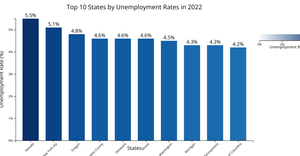
Fork of Bar Chart: Unemployment Rates by State
Fork of Choropleth with Histogram Brushing
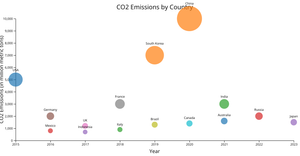
CO2 emissions bubble chart
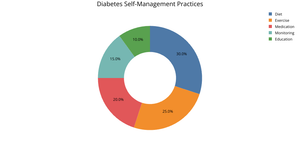
Diabetes Self-Management Practices Pie Chart
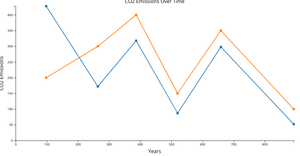
CO2 Emissions Data Time Series Line Chart
Data on CO2 and Greenhouse
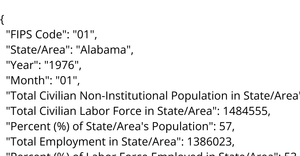
Unemployment in America Per US State

1. Diabetes Self-Management Data
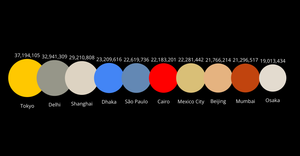
Top 10 Most Populated Cities
