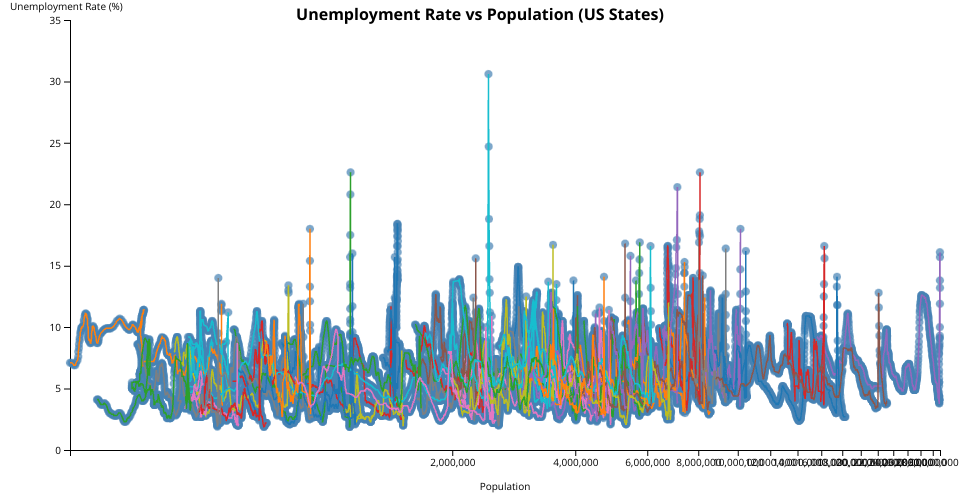
Unemployment Rate vs Population Scatter Plot Visualization This project visualizes the relationship between the population and unemployment rate across different US states over time using a scatter plot. The data is sourced from the @oabouhas/unemployment dataset The Unemployment in America Per US State, loaded and parsed as CSV., which contains historical information on employment statistics by state. This project uses D3.js to create an interactive scatter plot that shows the relationship between:
Total population of a state (X-axis) Unemployment rate in the state (Y-axis) This visualization aims to provide insights into the employment status in different US states over time.
MIT Licensed