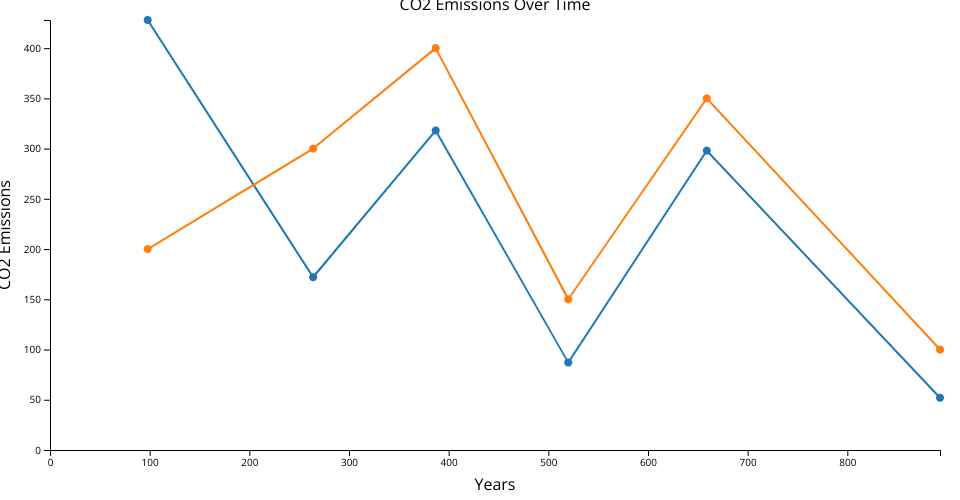
This project visualizes CO2 emissions over time for different countries using a time series line chart. The chart is designed to highlight trends and comparisons between countries, with distinct colors for each country and markers at data points to emphasize specific values.
MIT Licensed