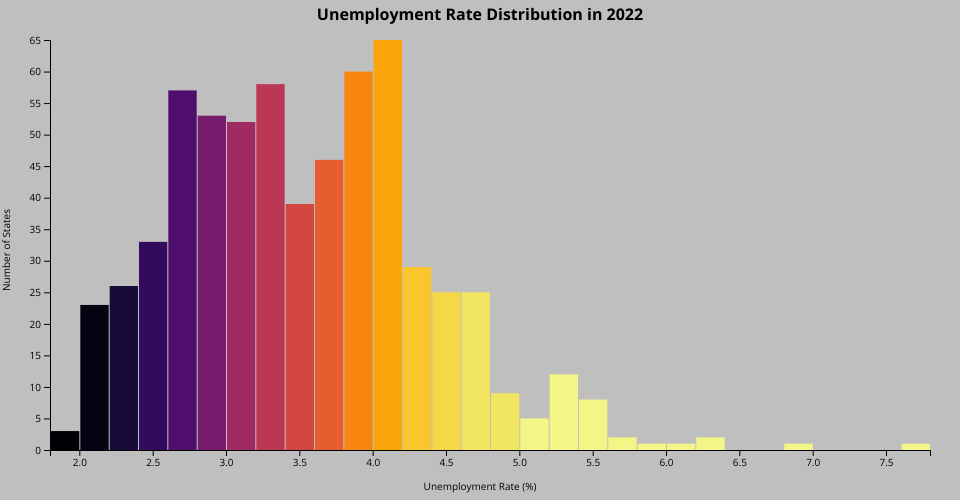
This project visualizes the distribution of unemployment
rates in the US for the year 2022 using a colored histogram.
The histogram bars are colored based on the unemployment
rate, providing a clear and informative visualization. -The
unemployment data is sourced from the
@oabouhas/unemployment package. The data includes the
unemployment rates for each state in the US for the
year 2022.
MIT Licensed