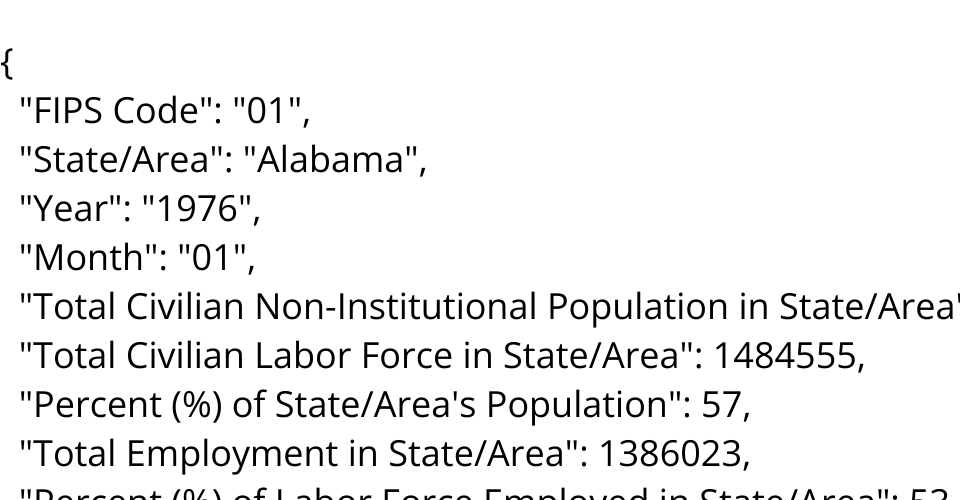
The Unemployment in America Per US State, loaded and parsed as CSV.
This dataset tracks unemployment per US state since 1976, including additional areas like the District of Columbia and major metropolitan divisions.
Tasks
Compare Unemployment Rates Across Different States:
- Visualize and compare the unemployment rates for each state to identify states with the highest and lowest unemployment rates.
Analyze Trends in Unemployment Rates Over Time:
- Track how unemployment rates have changed over the years or months to identify trends or seasonal patterns in unemployment.
Explore the Relationship Between Unemployment Rates and Economic Indicators:
- Investigate how unemployment rates correlate with other economic indicators such as GDP growth or inflation rates to understand the broader economic context.
Examine the Distribution of Unemployment Rates:
- Create histograms or box plots to visualize the distribution of unemployment rates across states and identify any unusual patterns or outliers.
Identify States with High Unemployment Risk Factors:
- Use the dataset to identify states with high unemployment rates and analyze potential factors contributing to their high unemployment levels.
MIT Licensed