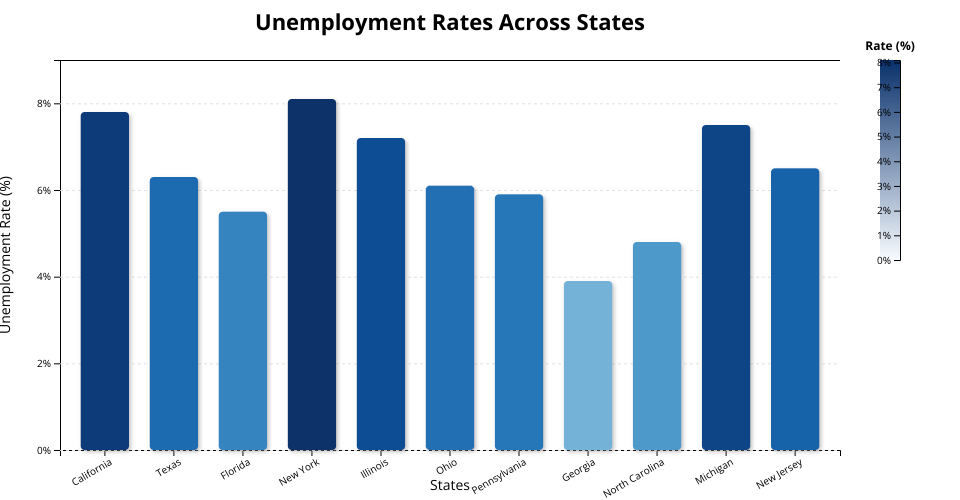
This Graph visualizes the unemployment rates across various states in the United States using a bar chart. Each bar represents a state's unemployment rate, with the color intensity indicating the rate—darker shades represent higher unemployment rates.
Features
Bar Chart:
- Displays unemployment rates for selected U.S. states.
- Bars are color-coded using a sequential blue scale, where darker shades represent higher unemployment rates.
- Bars have rounded corners and a shadow effect for a polished look.
Dynamic Tooltip:
- Displays the state name and unemployment rate when hovering over a bar.
Legend:
- Includes a vertical color scale legend on the right to visually connect unemployment rates to the color coding.
- Styled with a gradient and clear percentage labels.
Axes:
- X-axis represents state names and includes a label.
- Y-axis represents unemployment rates (%) with gridlines for better readability.
Chart Title:
- A centered title above the chart provides context for the visualization.
MIT Licensed