🌍 Public
Victory!
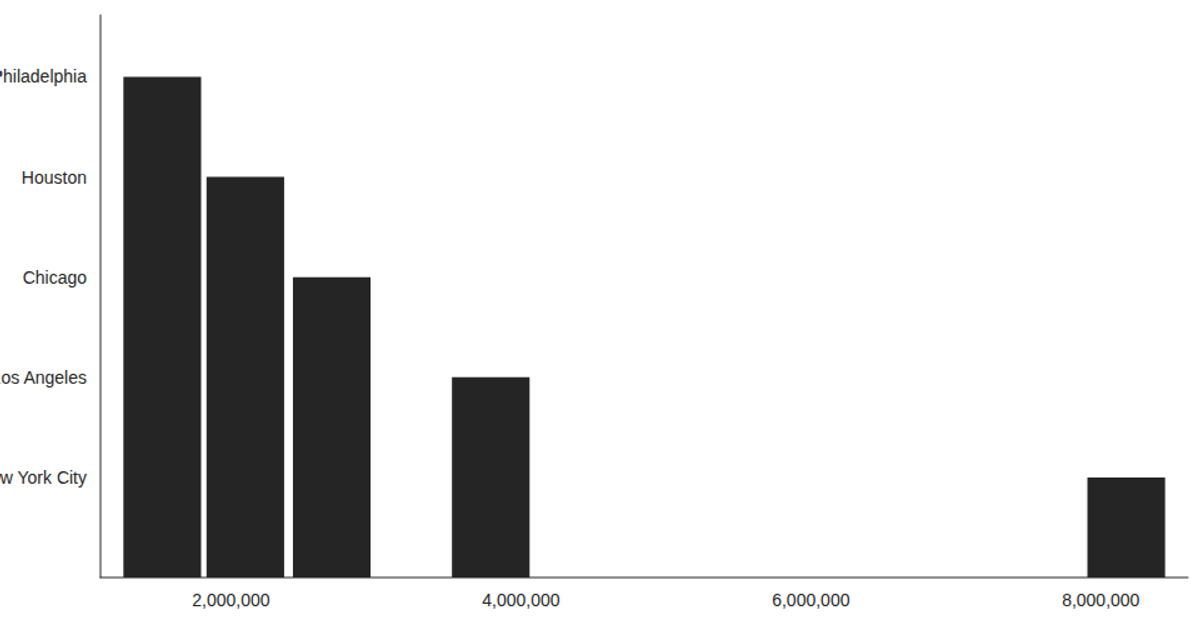
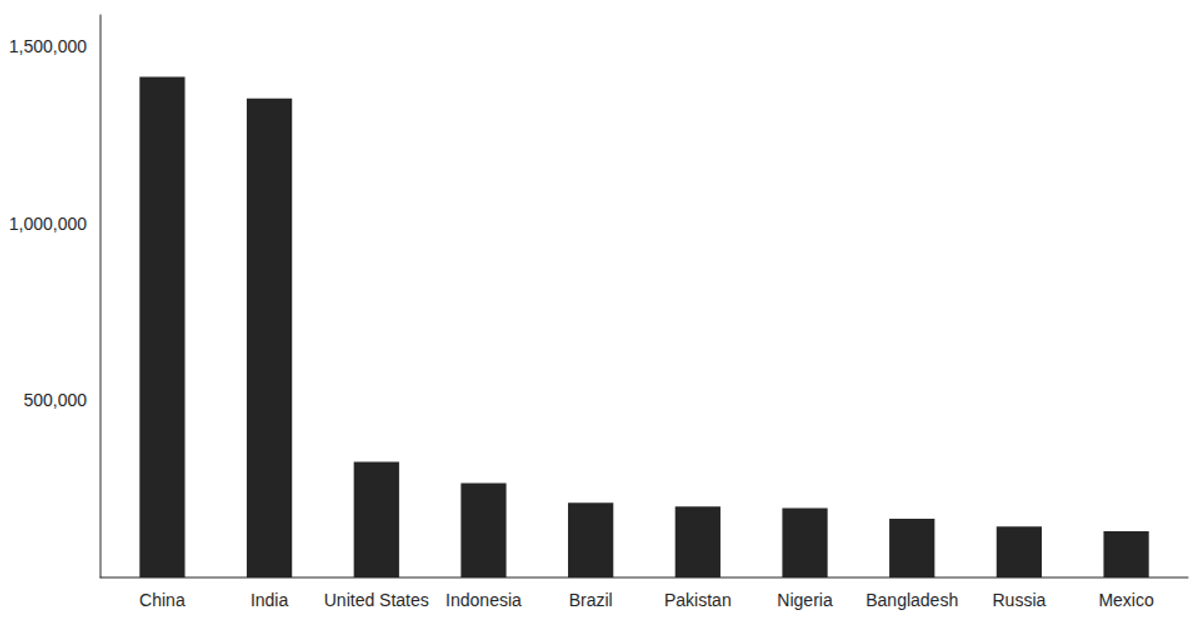
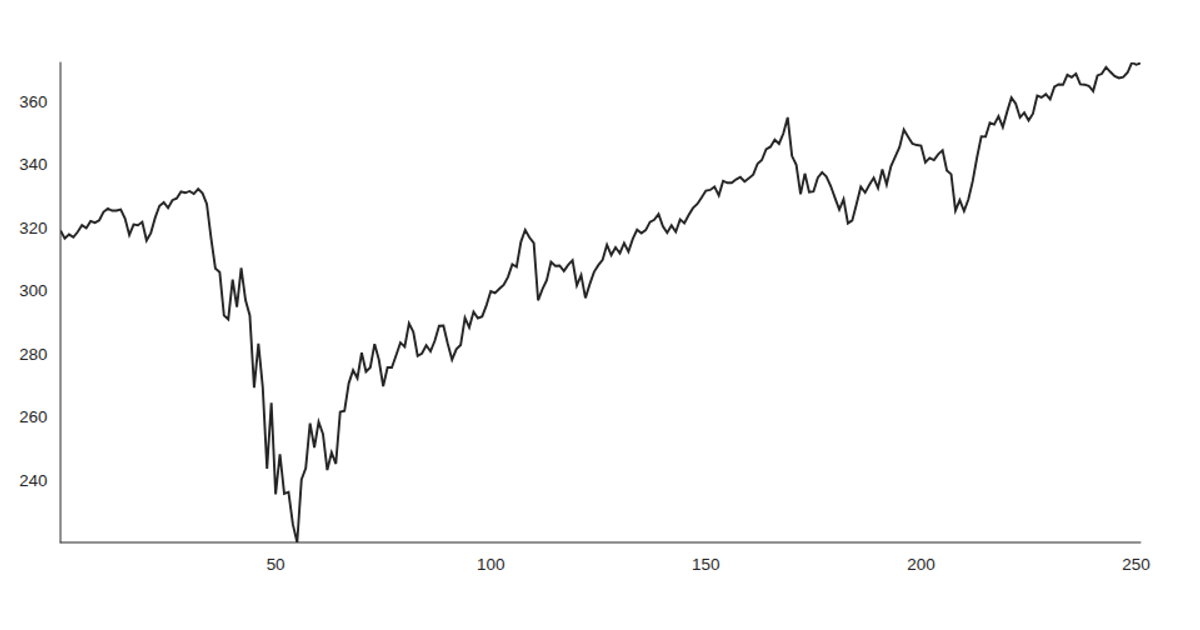
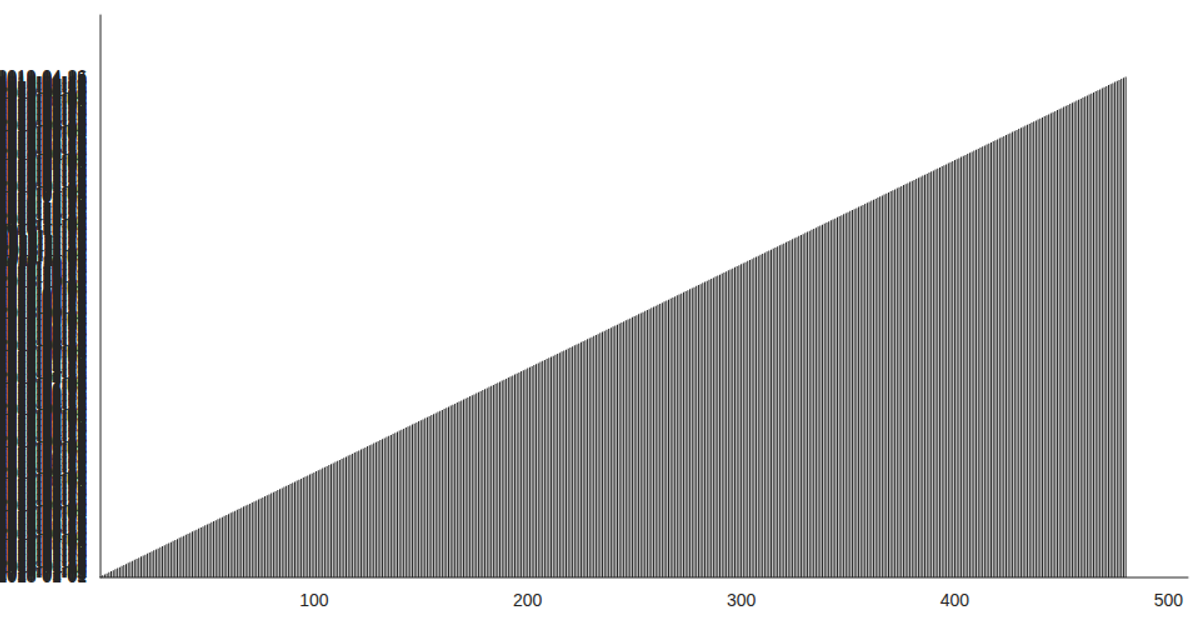
This example loads CSV data via React hooks and visualizes investment funding allocations using Victory Charts, rendered as an animated SVG dendrogram. It groups projects by investment type (Private or Government-led) into a hierarchical cluster layout, with nodes and links animated via D3 transitions. The visualization uses `d3.cluster`, `linkHorizontal`, and `ResizeObserver` to handle resizing, while data comes from a JSON file. Each leaf node displays the funding amount, and paths draw with stroke-dasharray animations.
AI-generated descriptionThis example shows how to load data from a CSV file using React hooks and visualize the result using Victory Charts. Inspired by this Victory example from Swizec Teller in React for Data Visualization.
MIT Licensed




Comments
Sign in to join the discussion.