🌍 Public
Victory!
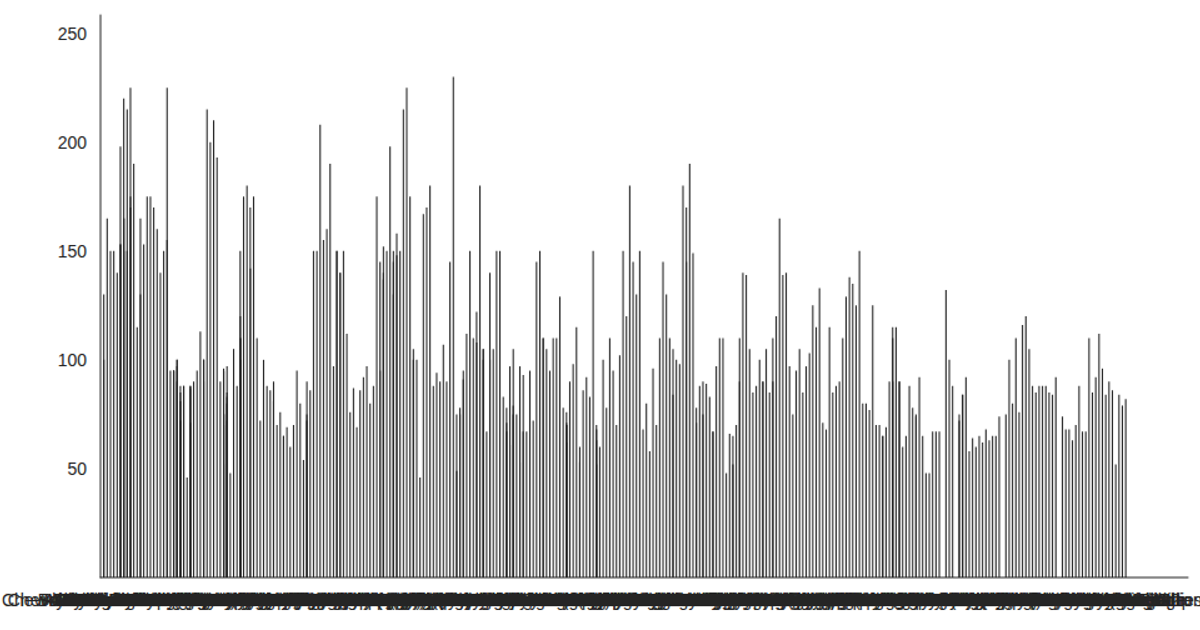
This example loads car data from a CSV file and renders a bar chart using Victory Charts within a React application. The code uses React hooks (`useState`, `useEffect`) to asynchronously fetch the data with `d3.csv` and parse the `Horsepower` field into numbers. The chart displays each car’s horsepower as a bar, with the data sourced from the provided `data.csv` file. The visualization is built with Victory’s `VictoryBar` and `VictoryChart` components, demonstrating a straightforward React-based data-loading and charting workflow.
AI-generated descriptionThis example shows how to load data from a CSV file using React hooks and visualize the result using Victory Charts. Inspired by this Victory example from Swizec Teller in React for Data Visualization.
MIT Licensed




Comments
Sign in to join the discussion.