🌍 Public
Victory!
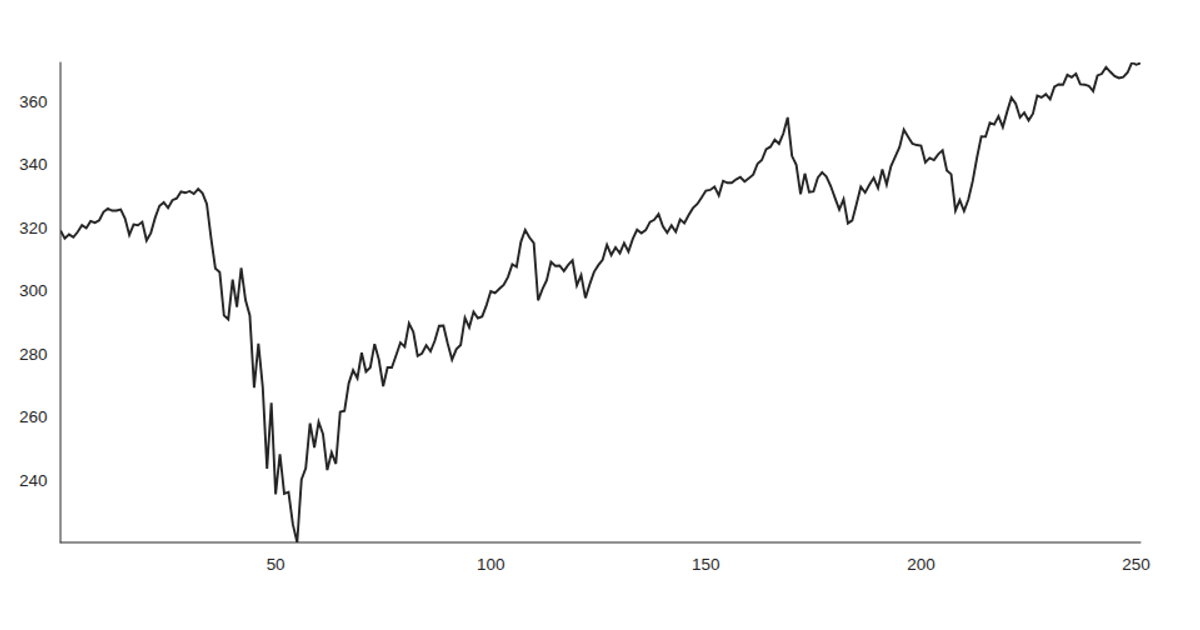
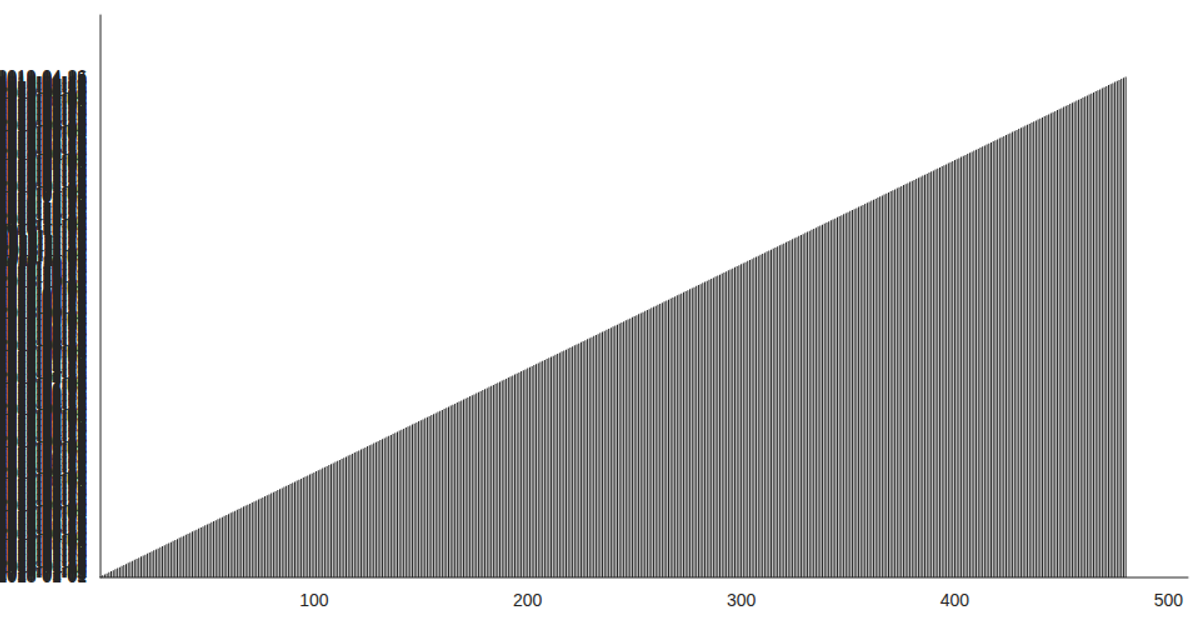
This example visualizes time-series data from a CSV file using Victory Charts within a React application. A line chart plots ADC_1 sensor readings against Unix timestamps, with data loaded asynchronously through the `csv` function from D3 v5 and managed via React’s `useState` and `useEffect` hooks. The `VictoryLine` and `VictoryChart` components render the chart, with styling applied through the `style` prop. The visualization demonstrates how to integrate D3 data loading with Victory’s declarative charting API in a React-based workflow.
AI-generated descriptionThis example shows how to load data from a CSV file using React hooks and visualize the result using Victory Charts. Inspired by this Victory example from Swizec Teller in React for Data Visualization.
MIT Licensed

Comments
Sign in to join the discussion.