🌍 Public
Fork of Victory!
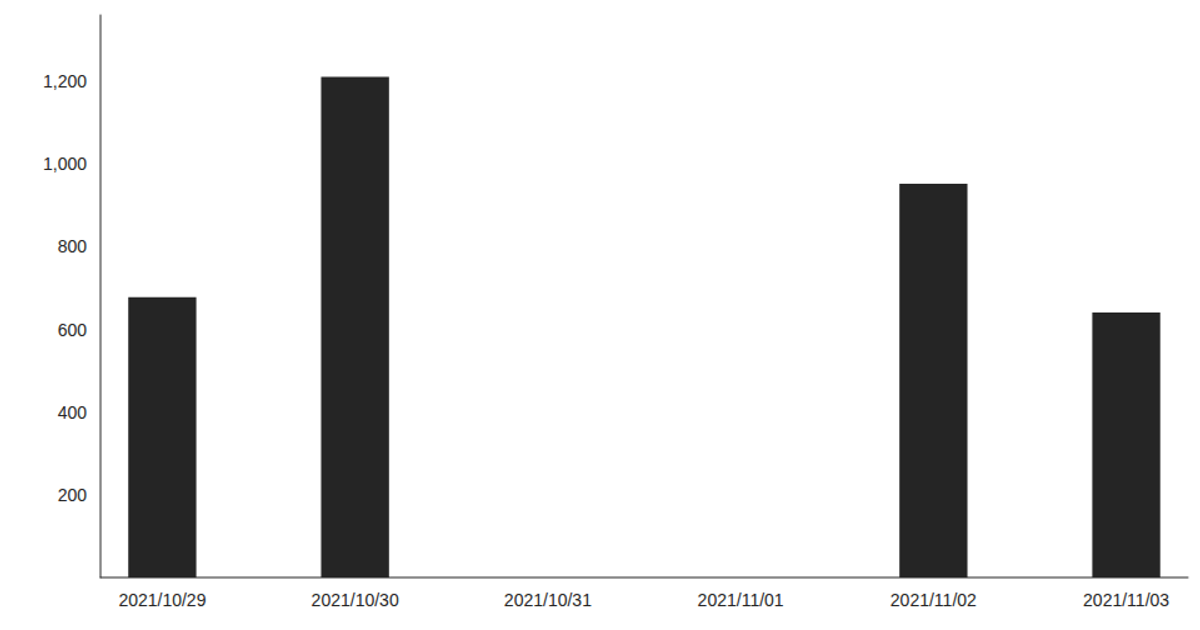
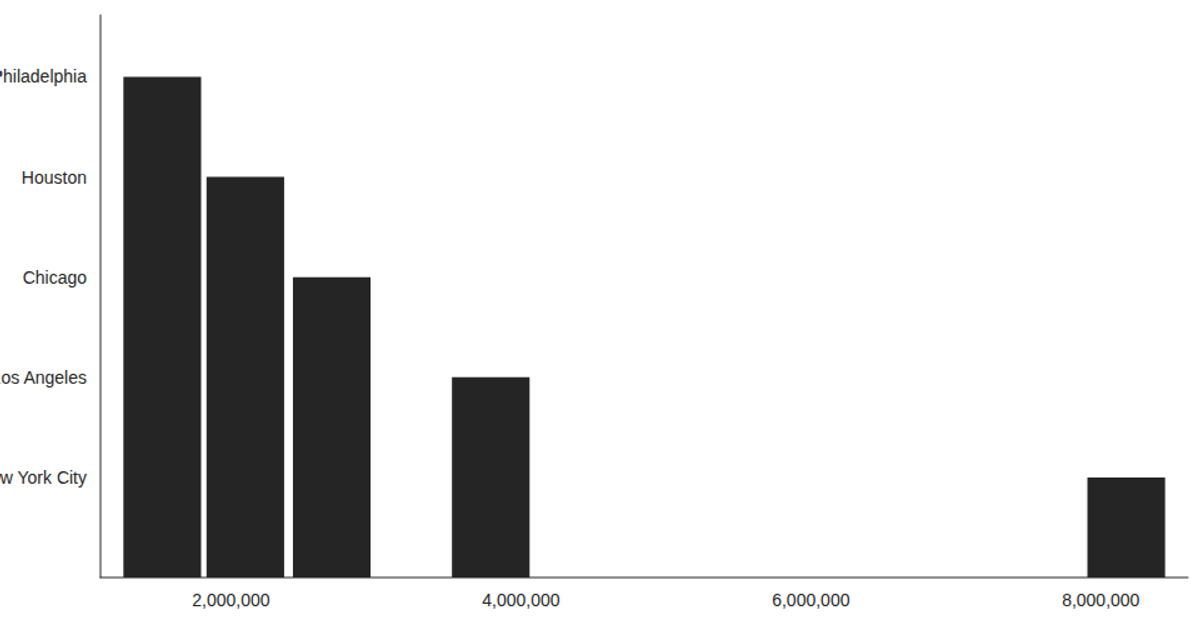
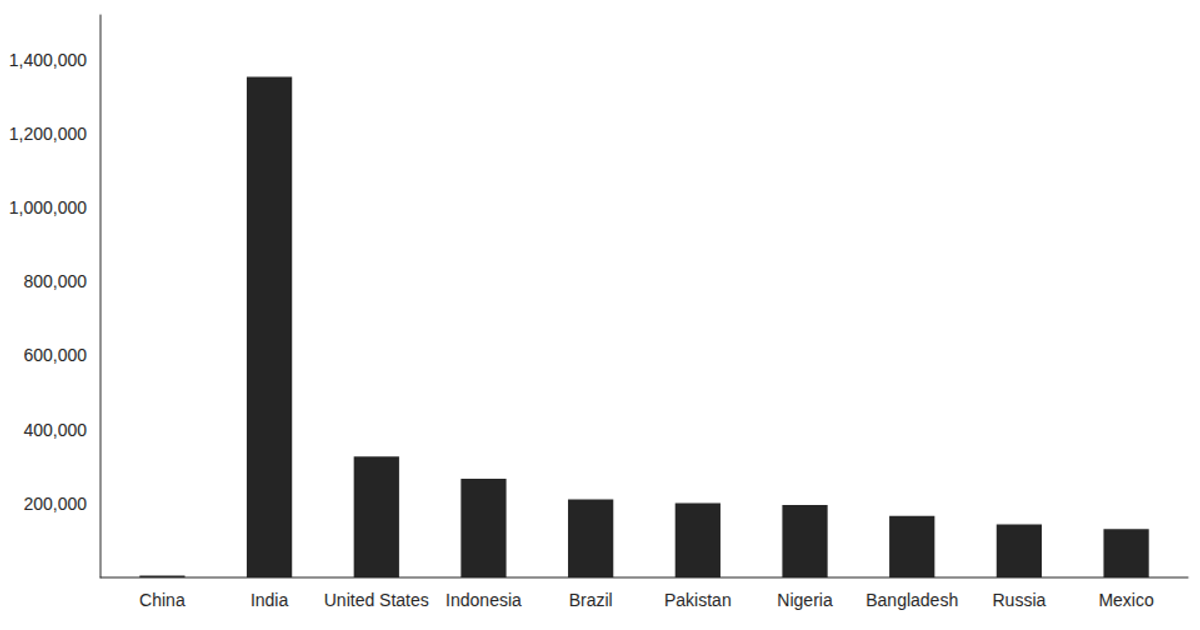
This example visualizes daily precipitation data for three locations using Victory Charts, rendered as a bar chart within a React application. It loads the dataset from a CSV file using the `csv` function from D3 v5, with React hooks managing the asynchronous data fetching. The chart specifically maps precipitation values from the columns `precipitation_221`, `precipitation_231`, and `precipitation_271` onto the x-axis against dates on the y-axis, using `VictoryBar` and `VictoryChart` components.
AI-generated descriptionThis example shows how to load data from a CSV file using React hooks and visualize the result using Victory Charts. Inspired by this Victory example from Swizec Teller in React for Data Visualization.
MIT Licensed





Comments
Sign in to join the discussion.