🌍 Public
Fork of Victory!
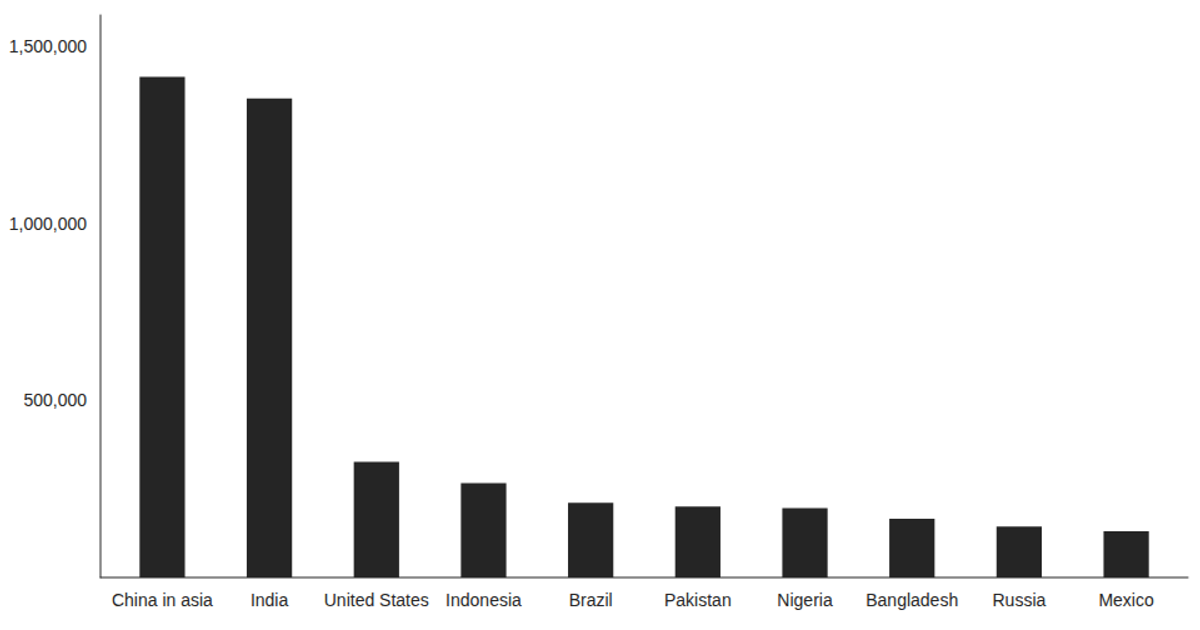
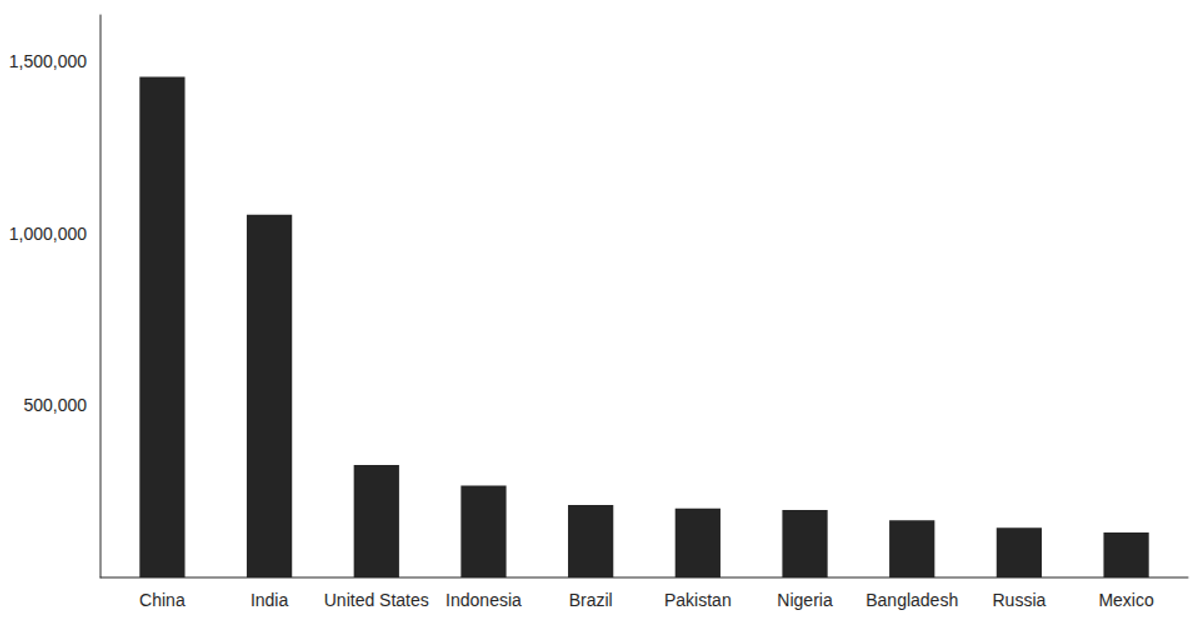
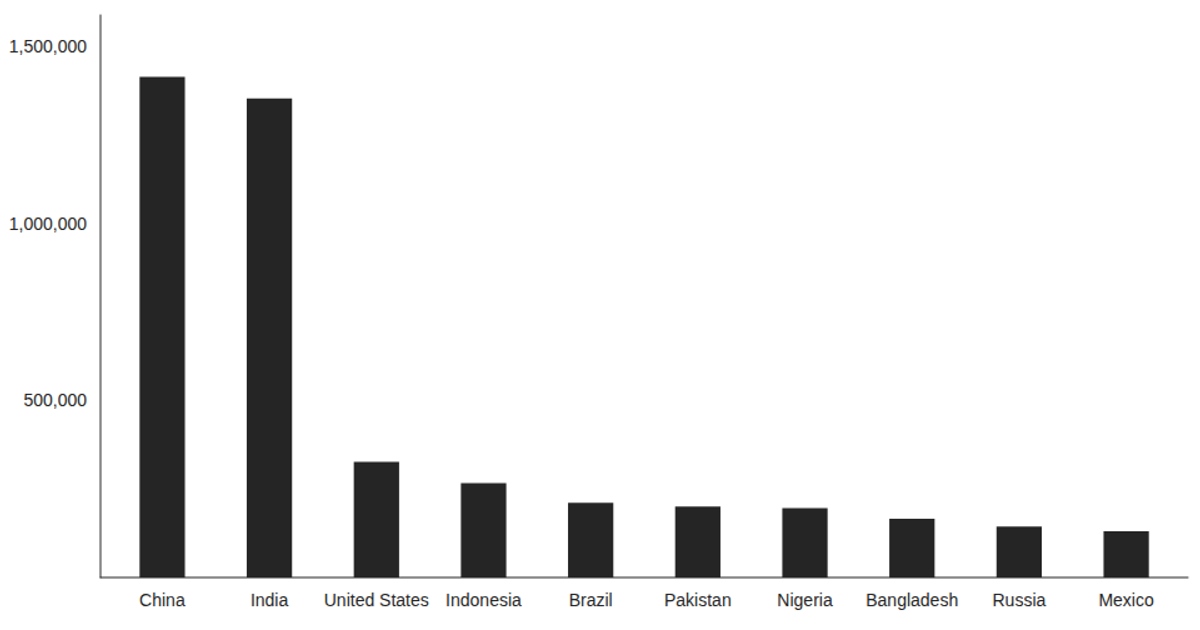
This example displays population data for ten countries as a bar chart built with Victory Charts, a React-based visualization library. The code loads a CSV file using d3.csv within a React `useEffect` hook, though the data is only logged to the console rather than rendered. The chart itself is not currently visible in the UI, which only shows a static heading. The example uses React 16.8, Victory 32.1, and D3 v5, and includes an embedded YouTube tutorial link in its README.
AI-generated descriptionThis example shows how to load data from a CSV file using React hooks and visualize the result using Victory Charts. Inspired by this Victory example from Swizec Teller in React for Data Visualization.
MIT Licensed




Comments
Sign in to join the discussion.