🌍 Public
Fork of Victory!
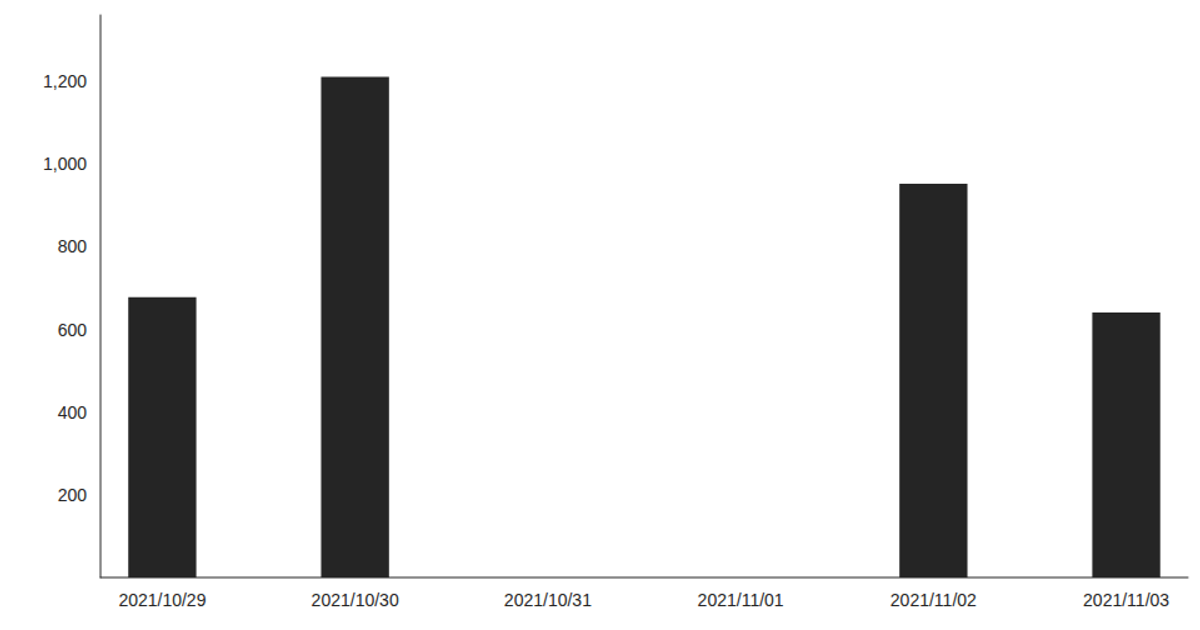
This example shows a line chart of daily stock prices over time, rendered with Victory Charts in a React application. The chart displays closing prices from a CSV file, with the line tracing fluctuations across the months. The code loads the data using D3’s `csv` method in a React hook, converting the `Price` values to numbers, and then passes the result to a `VictoryLine` component inside a `VictoryChart`. The visualization updates asynchronously once the CSV data is fetched.
AI-generated descriptionThis example shows how to load data from a CSV file using React hooks and visualize the result using Victory Charts. Inspired by this Victory example from Swizec Teller in React for Data Visualization.
MIT Licensed




Comments
Sign in to join the discussion.