🌍 Public
Fork of Victory!
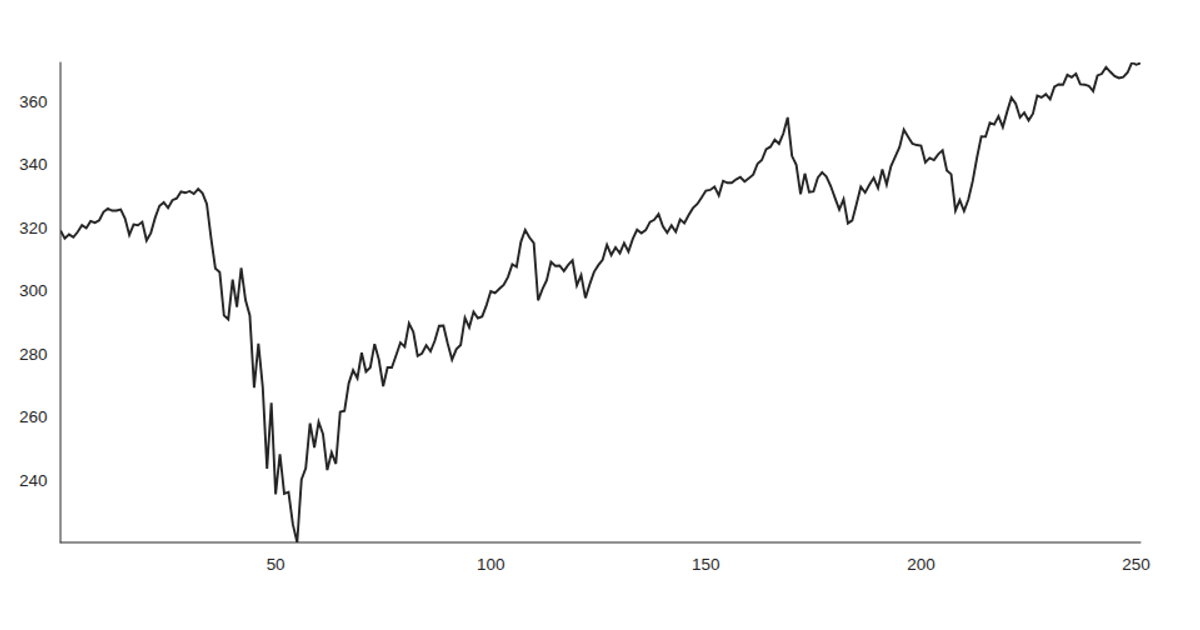
A line chart tracks the daily closing price of the SPY ETF from January through September 2020, using data loaded from a CSV file via the `d3.csv` API. The React component fetches the data asynchronously with a `useEffect` hook, then renders the series using Victory Charts' `VictoryChart` and `VictoryLine` components. The visualization reveals the sharp market drop in late February and March, followed by a gradual recovery through the summer months.
AI-generated descriptionThis example shows how to load data from a CSV file using React hooks and visualize the result using Victory Charts. Inspired by this Victory example from Swizec Teller in React for Data Visualization.
MIT Licensed



Comments
Sign in to join the discussion.