Fork of Victory!
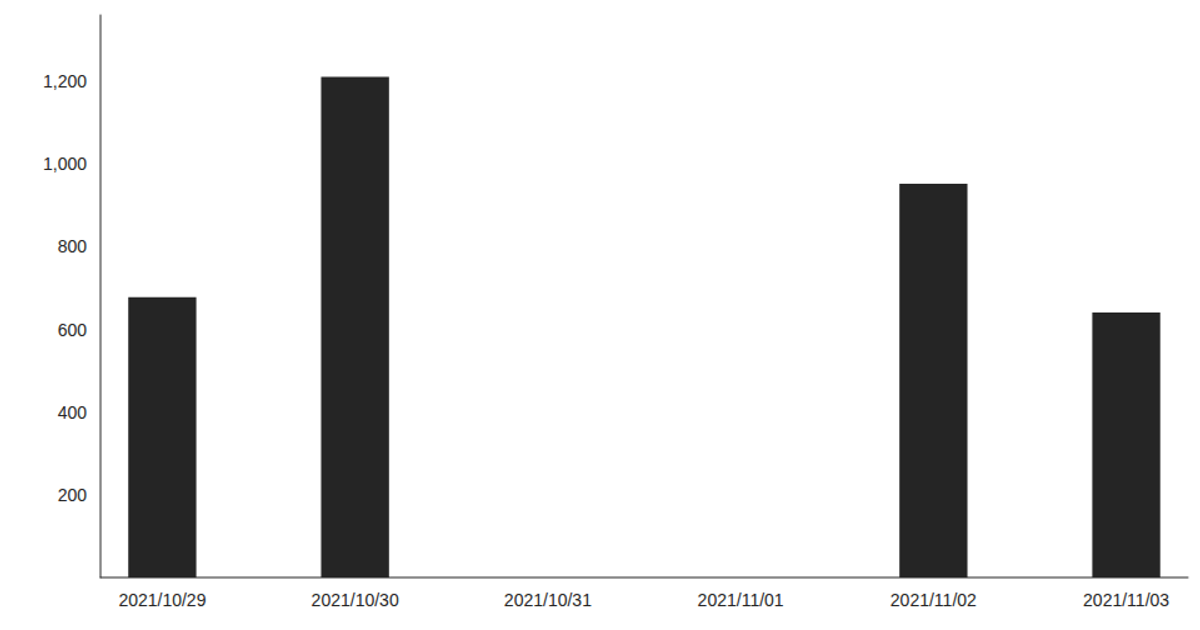
This example visualizes WiFi network activity from a CSV file, displaying daily metrics for Connected users, Visitors, and Passersby over time using Victory Charts in a React application. The code loads the time-series data with D3’s `csv` function and renders it as a bar chart via `VictoryBar` and `VictoryChart`. The visualization shows how daily interactions fluctuate, with a noticeable spike in usage around mid-July. The chart uses a custom style with large tick labels and fixed dimensions, demonstrating the integration of React hooks (`useState`, `useEffect`) for data loading and rendering.
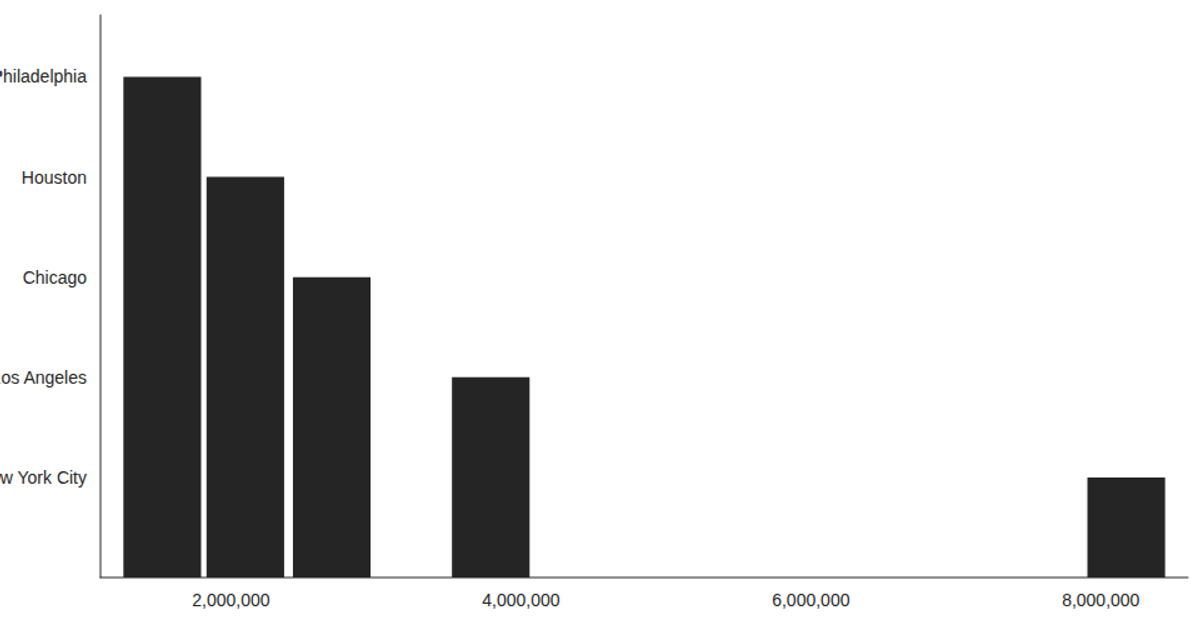
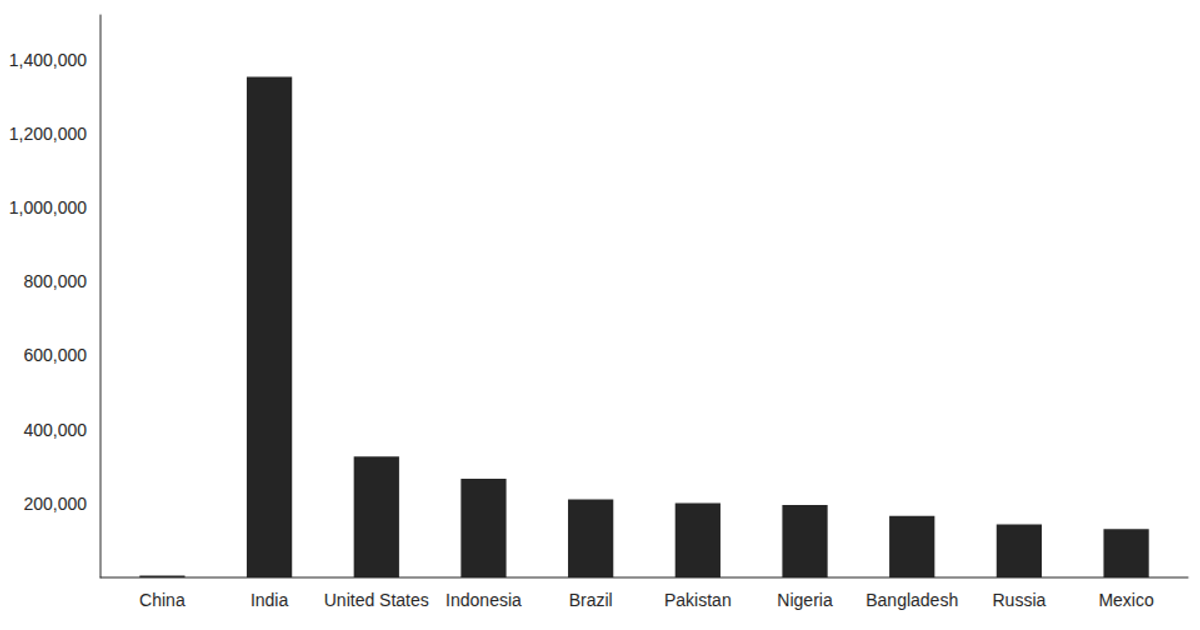
AI-generated descriptionThis example shows how to load data from a CSV file using React hooks and visualize the result using Victory Charts. Inspired by this Victory example from Swizec Teller in React for Data Visualization.




Comments
Sign in to join the discussion.