🌍 Public
Sreenivas Varma_ICE8_Networkgraph
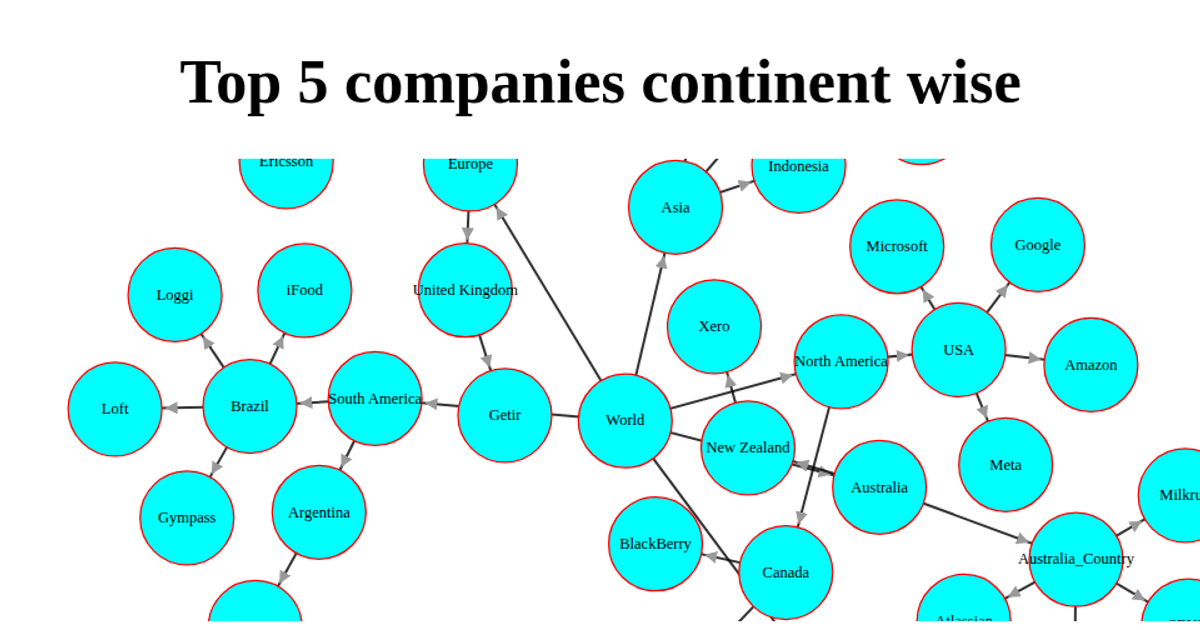
This interactive network graph visualizes tech layoffs across continents, countries, and specific companies. The visualization uses a hierarchical structure where the central node, "Tech-Layoffs," connects to six continental nodes, which then branch to country nodes and finally to individual company nodes. The graph is rendered as an SVG using D3 v6, with nodes positioned through a physical simulation driven by `d3.forceSimulation`, combining link, charge, collision, and center forces. Users can drag nodes, and the system updates positions in real-time via the simulation's tick event, with all styling and interactions defined in the accompanying CSS file.
AI-generated descriptionMIT Licensed



Comments
Sign in to join the discussion.