🌍 Public
Network Graph
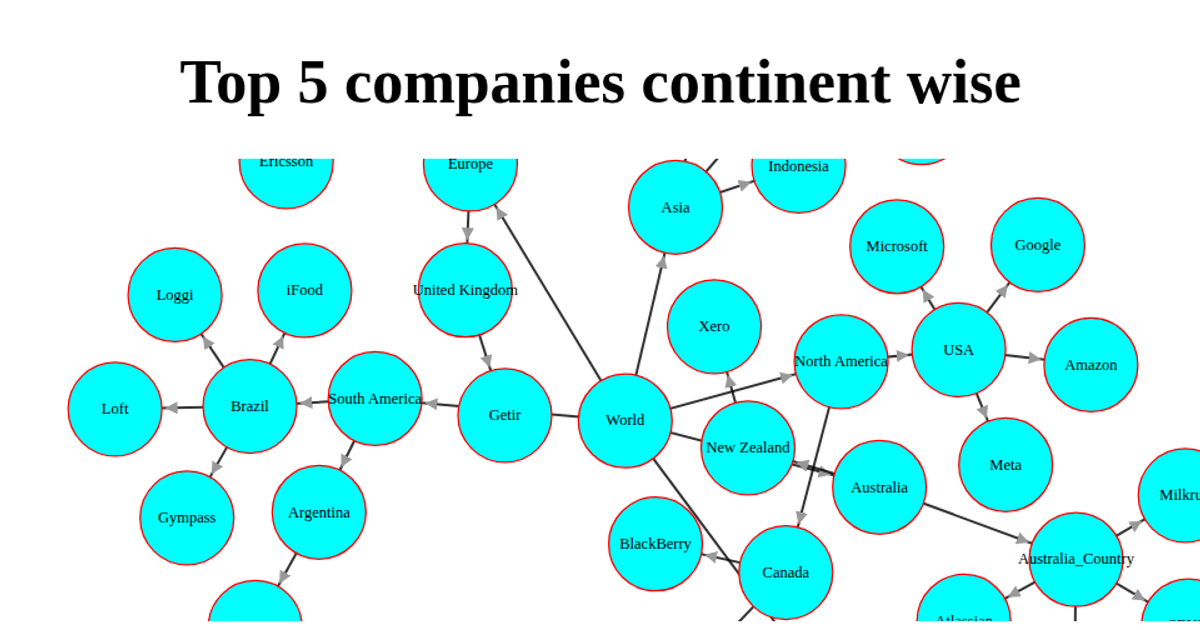
This network graph visualizes startup layoffs across industries and countries, with nodes colored by category (red for tech layoffs, blue for industry sectors, green for countries, yellow for individual companies). The graph uses d3.forceSimulation with link distance and many-body charge forces to position nodes, while d3.drag enables interactive node movement. Links connect companies to their respective industry and country, revealing geographic distribution patterns. The visualization renders in SVG and uses D3 v7 within a plain HTML page.
AI-generated descriptionA bare minimum HTML page demonstrating use of CSS and JavaScript.
See also React Starter.
MIT Licensed




Comments
Sign in to join the discussion.