🌍 Public
Fork of Kartheek_ICE8_Networkgraph
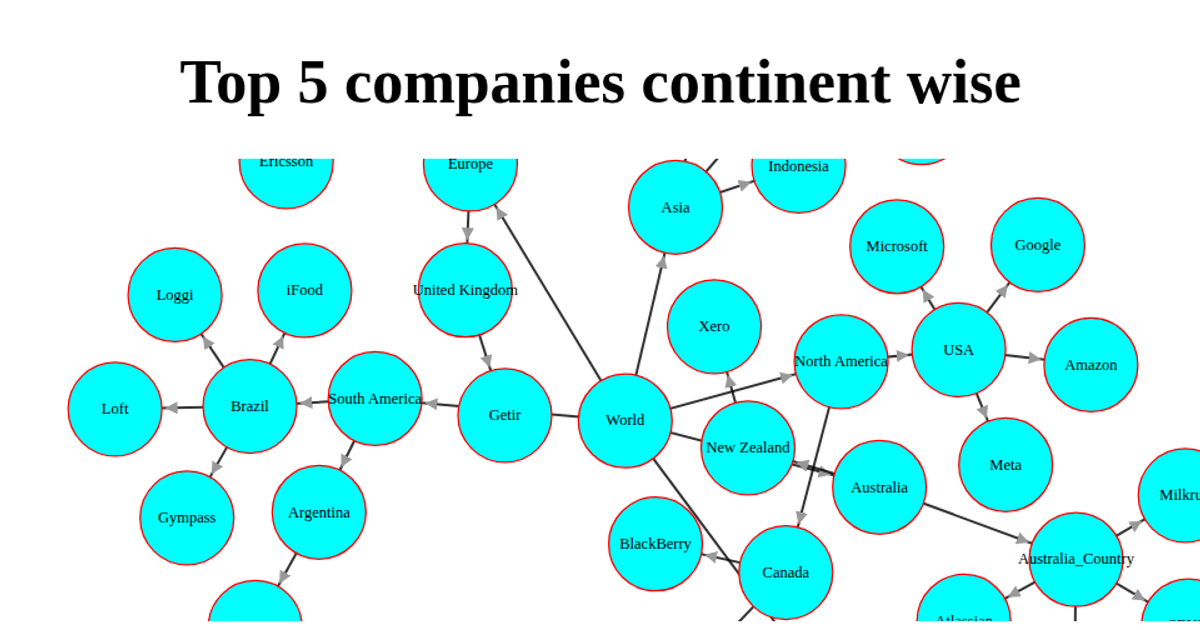
This network graph visualizes the global distribution of tech layoffs across continents and countries, using a hierarchical structure of nodes and links. A central "Tech-Layoffs" node branches into continent nodes, which further connect to specific countries and company names. The visualization uses `d3.forceSimulation` with `forceLink`, `forceManyBody`, and `forceCollide` to position the nodes, with `d3.drag()` enabling interactive node manipulation. All nodes are rendered as cyan circles with red strokes, and the data comes from a local `data.json` file.
AI-generated descriptionMIT Licensed



Comments
Sign in to join the discussion.