🌍 Public
Kartheek_ICE8
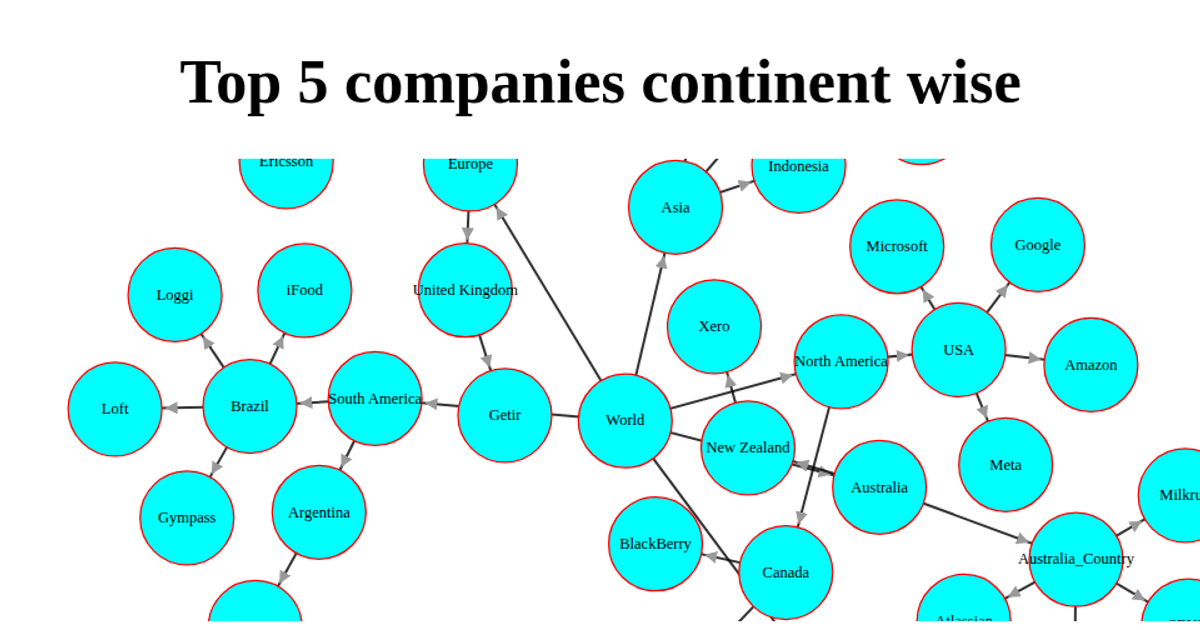
This interactive tree chart visualizes tech layoffs across continents, countries, and companies. The hierarchical data is rendered as an animated SVG using D3.js (v3), with distinct node shapes and colors for each level: cyan circles for continents, green rectangles for countries, and cyan squares for companies. White links connect the nodes, and a legend explains the visual encoding. The chart uses D3’s tree layout, with nodes that respond to cursor events, and the entire graphic is set against a skyblue background.
AI-generated descriptionThis is a description using Markdown.
MIT Licensed




Comments
Sign in to join the discussion.