🌍 Public
Sreenivas Varma ICE-8
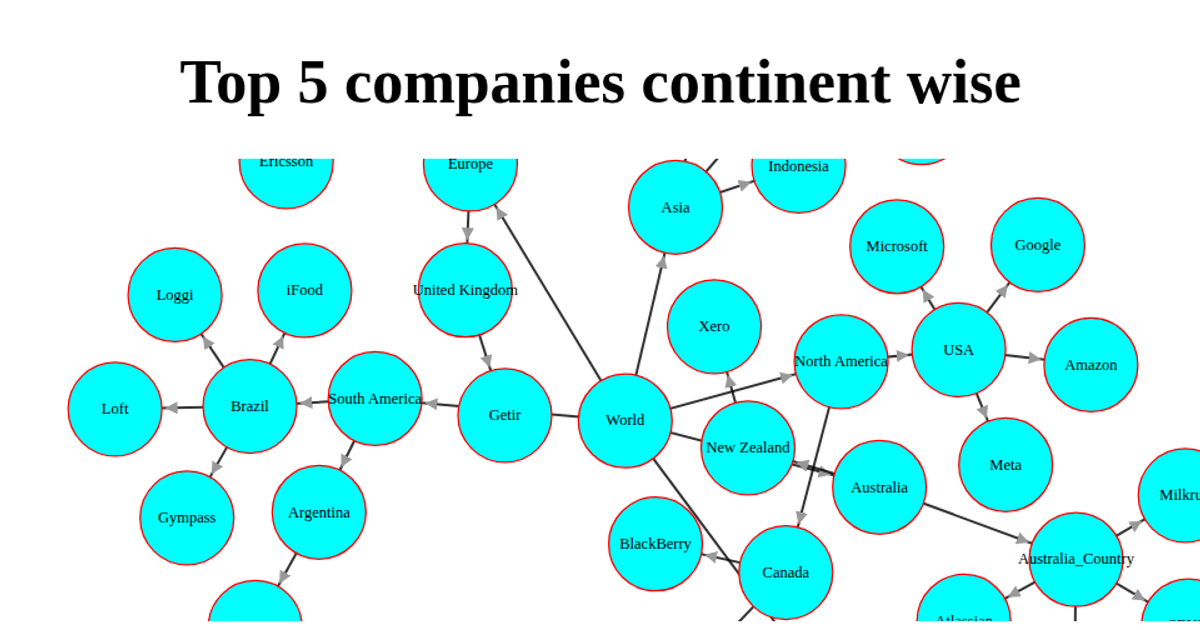
This cluster tree chart visualizes technology layoffs across global regions and countries, using a hierarchical structure that branches from continents down to specific companies. The interactive diagram displays company names as leaf nodes, organized by geographic location to reveal patterns of workforce reductions. Built with D3.js and rendered as SVG, the visualization employs d3.layout.cluster for the tree layout algorithm and d3.svg.diagonal for the connecting links, with a light gray background and steel blue node styling.
AI-generated descriptionThis is a description using Markdown.
MIT Licensed




Comments
Sign in to join the discussion.