🌍 Public
react-hooks-victory-example
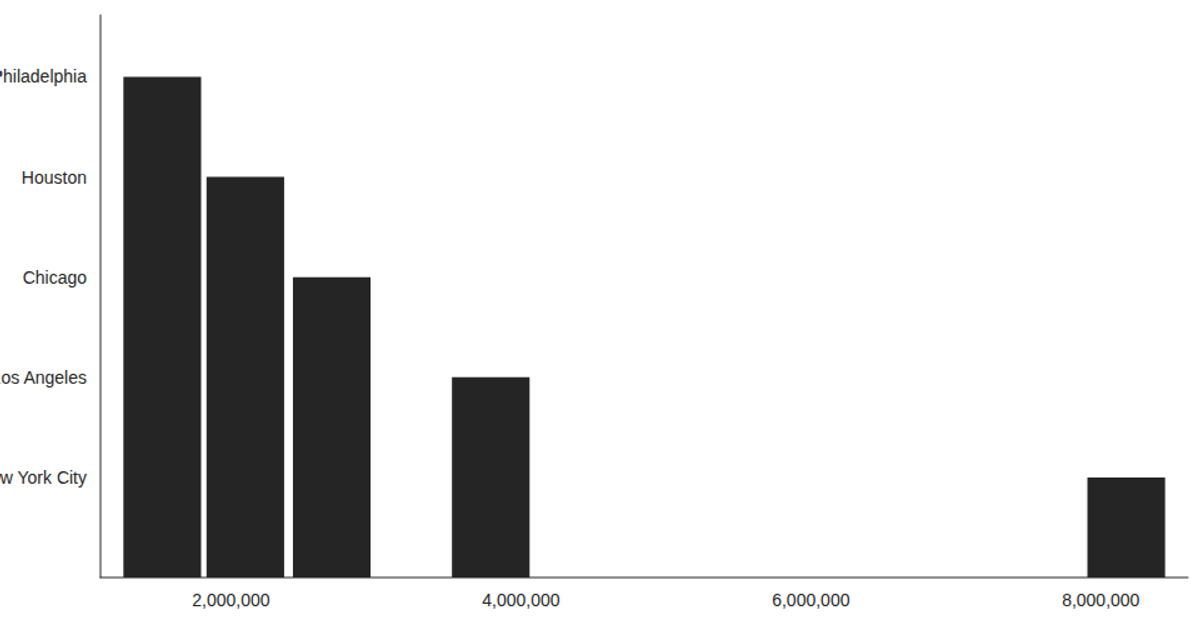
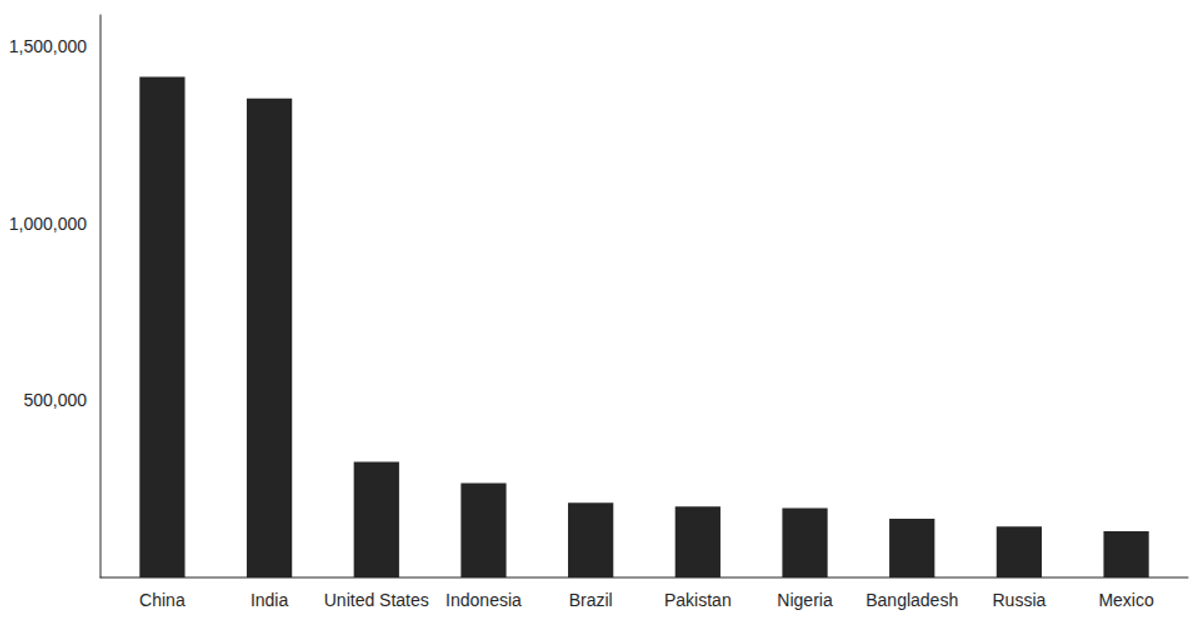
This example visualizes COVID-19 total cases across London boroughs using a bar chart, with the x-axis showing area names and the y-axis displaying total case counts. It loads data from a CSV file using the React `useState` and `useEffect` hooks, parsing the values with D3’s `csv` method. The chart is rendered with Victory’s `VictoryBar` and `VictoryChart` components, styled with custom padding and tick label fonts. The code demonstrates a React integration with Victory and D3 for asynchronous data loading and visualization.
AI-generated descriptionThis example shows how to load data from a CSV file using React hooks and visualize the result using Victory Charts. Inspired by this Victory example from Swizec Teller in React for Data Visualization.
MIT Licensed






Comments
Sign in to join the discussion.