🌍 Public
Lab07, Gráfico de Barras.
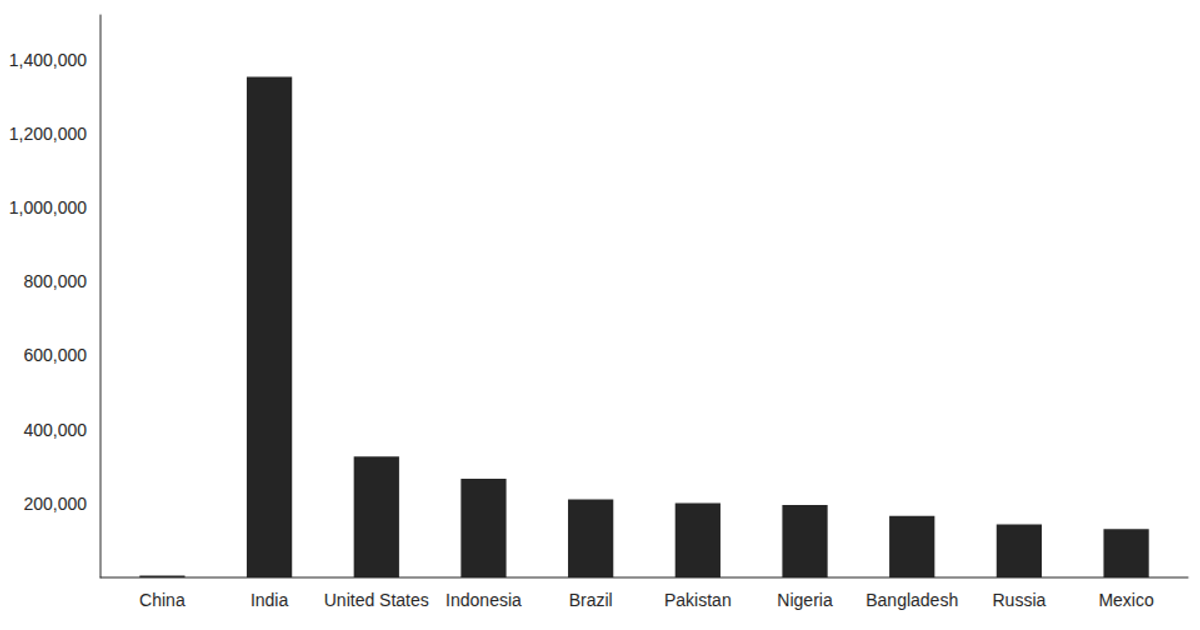
This example renders a bar chart of monthly population counts using React hooks and Victory Charts. It loads data from a CSV file via the `d3.csv` method inside a `useEffect` hook, then displays the result with `VictoryBar` and `VictoryChart`. The chart maps the "country" column to the x-axis and "population" to the y-axis, with custom styling applied through Victory’s style props. The visualization demonstrates asynchronous data fetching and declarative chart composition in a React component.
AI-generated descriptionThis example shows how to load data from a CSV file using React hooks and visualize the result using Victory Charts. Inspired by this Victory example from Swizec Teller in React for Data Visualization.
MIT Licensed




Comments
Sign in to join the discussion.