Related example · dataset not verified
OpenRouter LLM API Pricing
By Curran Kelleher
Compare model output-token pricing across AI providers.
Explore visualizationVizHub showcase
Explore interactive visualizations for real analytical problems, from macroeconomic signals and sales performance to population trends and scientific research. Open the live example and inspect the source, then adapt the approach to your own data.
32 editorially selected public examples across 10 sections. Examples from semantic search are provisional; an example labeled “Related” is not claimed to use the corresponding downloadable dataset.
Compare the cost, adoption, and structure of emerging technologies.
Related example · dataset not verified
By Curran Kelleher
Compare model output-token pricing across AI providers.
Explore visualizationRelated example · dataset not verified
By Curran Kelleher
Track weekly npm downloads in a compact trend chart.
Explore visualizationRelated example · dataset not verified
By sainitish1999
Explore linked programming languages and concepts.
Explore visualizationTurn revenue, transaction, and audience data into interactive decisions.
Related example · dataset not verified
By Ramdas Dheeraj
Explore sales statistics, charts, and underlying CSV records.
Explore visualizationRelated example · dataset not verified
By Bismark Kofi Owusu Sarfo
Investigate regional sales volumes and performance trends.
Explore visualizationRelated example · dataset not verified
By Vinay Vemuri
Relate campaign clicks and conversions in a bubble plot.
Explore visualizationAnalyze inflation, interest rates, markets, jobs, and wages.
Dataset connection verified
By Curran Kelleher
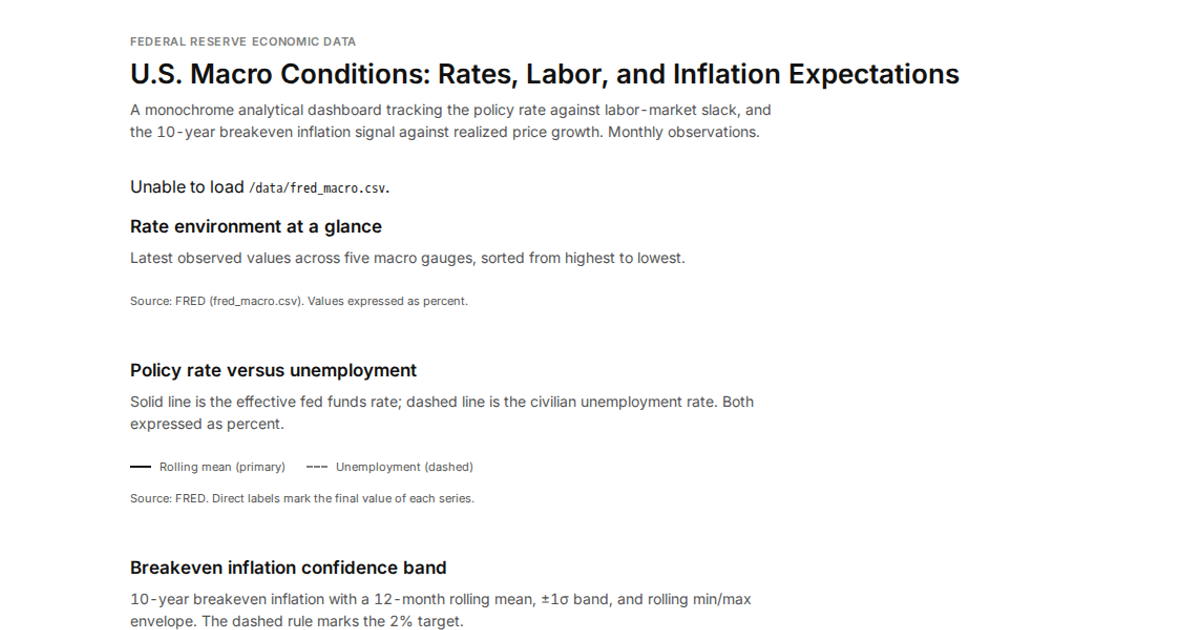
Four coordinated views: rate environment, policy versus unemployment, breakeven inflation, and labor-market relationships.
Explore visualization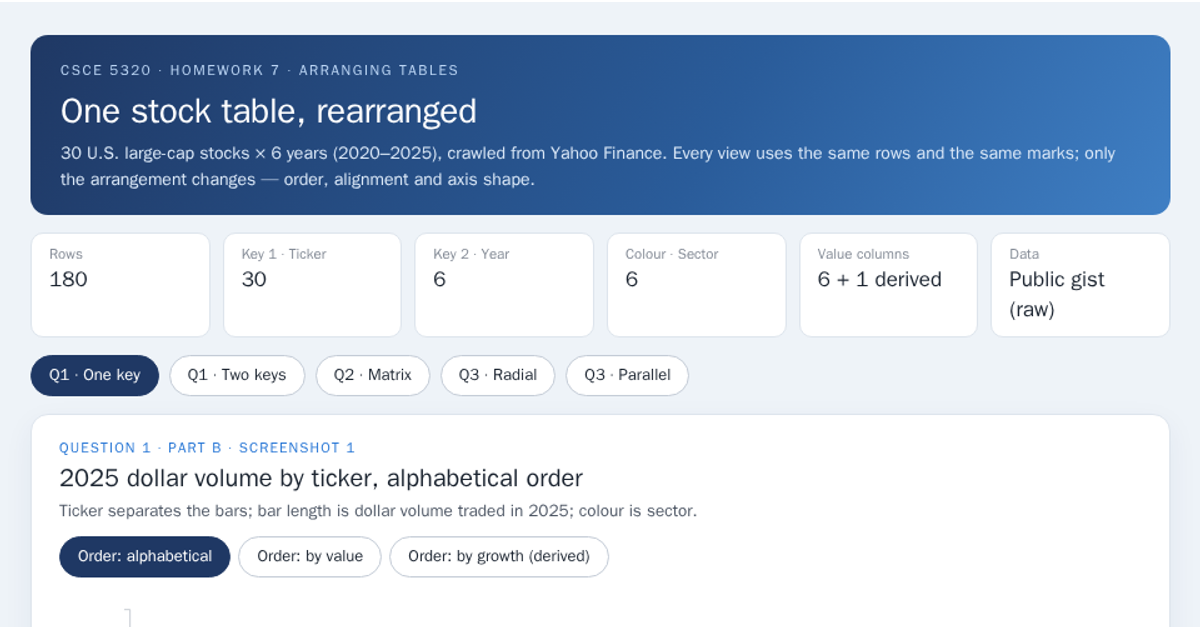
Related example · dataset not verified
By Haiyan Sun
Explore financial market returns, volatility, and drawdowns by sector.
Explore visualizationRelated example · dataset not verified
By Curran Kelleher
Compare unemployment rates across U.S. counties.
Explore visualizationRelated example · dataset not verified
By David Emmanuel Katz
Map quarterly restaurant wages across U.S. counties.
Explore visualizationMake population, migration, geography, and social trends understandable.
Related example · dataset not verified
By Jorge Emilio Zapata Godoy
Compare regional population trajectories from 1950 to 2100.
Explore visualizationRelated example · dataset not verified
By moba99
Explore countries by geographic region and subregion.
Explore visualizationRelated example · dataset not verified
By ala-wahibi
Explore county-level race and ethnicity estimates with a dot-density view.
Explore visualizationRelated example · dataset not verified
By jessand4
See intercounty commuting flows as a network of origins and destinations.
Explore visualizationRelated example · dataset not verified
By Christopher Repka
Display county boundaries with geographic projections.
Explore visualization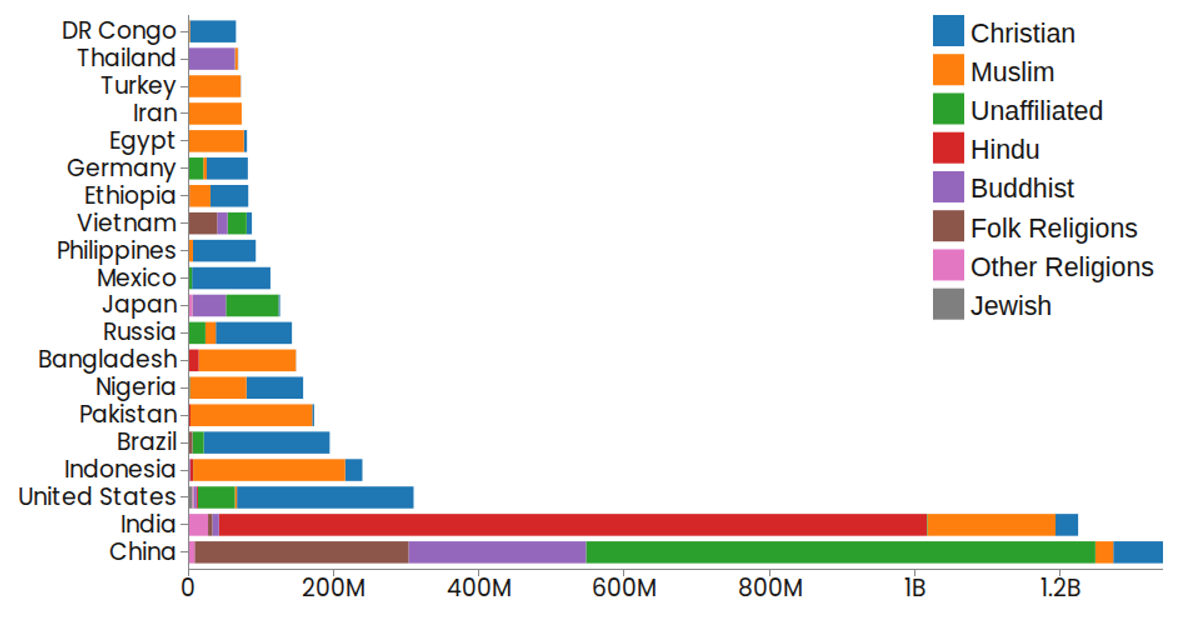
Related example · dataset not verified
By mroufail72
Compare estimated religious composition by country with interactive stacked bars.
Explore visualizationRelated example · dataset not verified
By amanipeddolla
Compare activity shares with a stacked bar chart.
Explore visualizationStudy geographic health variation and population-level outcomes.
Related example · dataset not verified
By Ridhima Saxena
Explore relationships among public-health measures using variable selectors.
Explore visualizationRelated example · dataset not verified
By Dasbach.EJ
Investigate multi-panel national case and death trends.
Explore visualizationExplore mobility networks, travel patterns, and urban movement.
Related example · dataset not verified
By inroadings
Explore U.S. airports and flight connections on a map.
Explore visualizationRelated example · dataset not verified
By Umarani Vemula
Compare taxi trip distance with pickup hour.
Explore visualizationMake research, weather, and environmental data explorable.
Related example · dataset not verified
By muzzheng
Explore exoplanet mass, orbital periods, and discovery properties.
Explore visualizationRelated example · dataset not verified
By Curran Kelleher
Explore the 2024 NOAA storm events dataset in an interactive prototype.
Explore visualizationRelated example · dataset not verified
By Curran Kelleher
Interactively compare species and body measurements in Palmer Penguins.
Explore visualizationMap plays, stories, and character connections.
Related example · dataset not verified
By Mihir Sawant
Explore shot placement in the 2018 World Cup final; a technique reference for the 2022 dataset.
Explore visualizationRelated example · dataset not verified
By Jason
Explore film releases on an interactive Star Wars timeline.
Explore visualizationRelated example · dataset not verified
By Samanvitha1
Use a force-directed social graph as a character-network technique reference.
Explore visualizationPlayful, accessible learning experiences built with visualization techniques.
Interactive experience
By Curran Kelleher
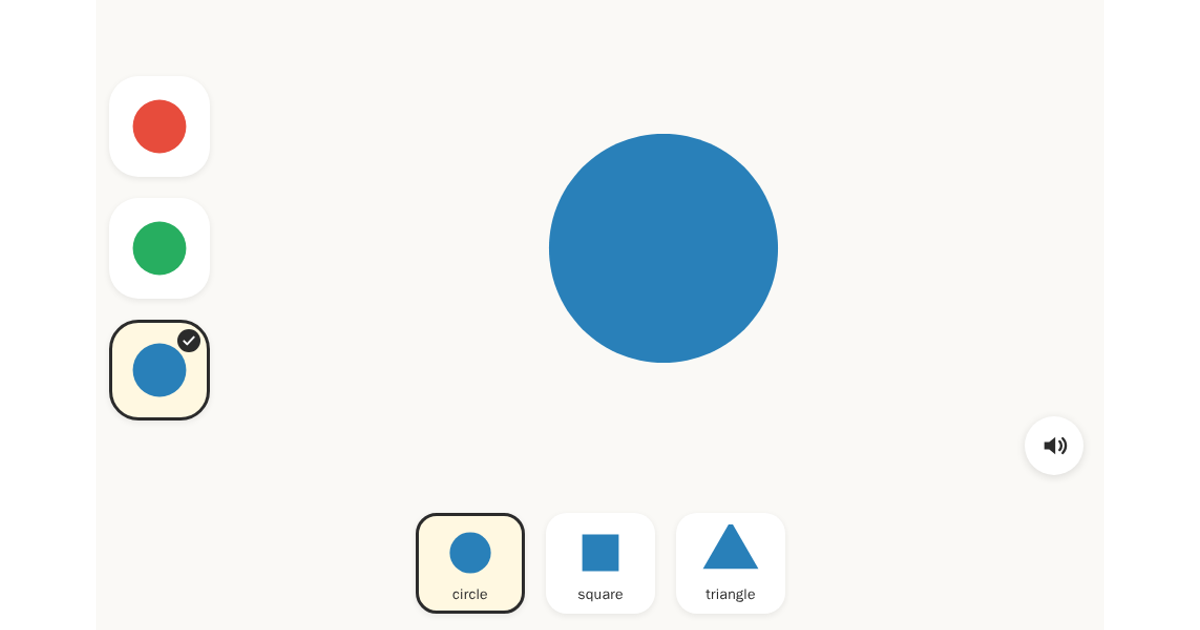
An accessible learning toy for ages 3–7: choose a color and shape, watch it morph, and hear the selection spoken aloud.
Explore visualizationInteractive experience
By sleyus
An interactive educational shape-and-color activity; related inspiration for classroom use.
Explore visualizationInteractive play, physics, and simulations built with code.
Interactive experience
By Curran Kelleher
Drag and fling colorful balls in a gravity and collision simulation.
Explore visualizationInteractive experience
By Curran Kelleher
Explore Conway's Game of Life evolving over a rotating 3D torus.
Explore visualizationInteractive experience
By Nita
Play a Sudoku puzzle with difficulty settings, a timer, and hints.
Explore visualizationChoose a public visualization to inspect, fork it when permitted, or start from a downloadable dataset. VizHub keeps source code, iterations, and reviewable AI edits together.