0 views in last 90 days
bootshine2
@bootshine2
Public vizzes

Steve's Smiley Face Part I

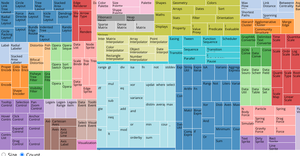
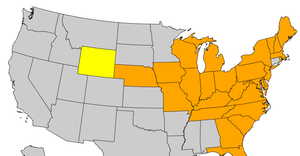
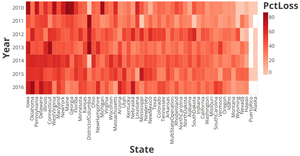
US States Heatmap of Bee Colony Loss
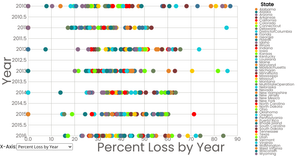
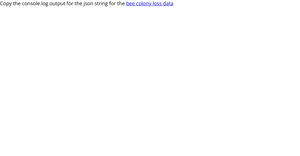
Steve's Scatter Plot with Color, Legend, and Dropdown
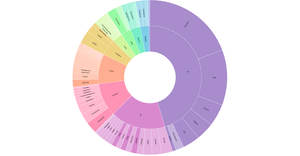
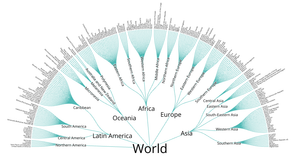
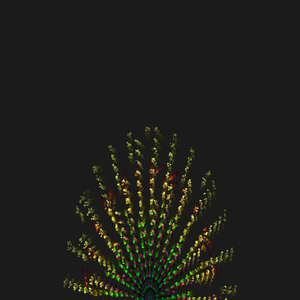
D3 v5 Zoomable Sunburst of Bee Colony Statistics in the US
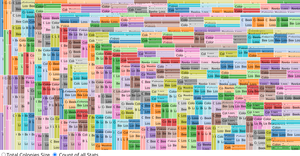
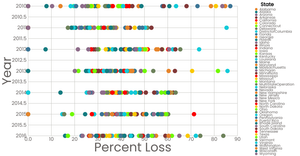
Treemap of Bee Colonies, Beekeepers, and Bee Colony Loss Numbers by State
Bee Colony Loss Data JSON File String Maker
Steve's Scatter Plot with Color and Legend
Treemap from bl.ocks.org
Fixed projection for US States

My USA Map
Untitled
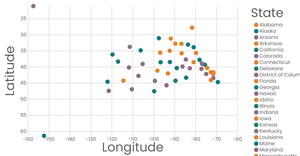
Steve's Scatter Plot of State Lats and Longs

Points on My World Map
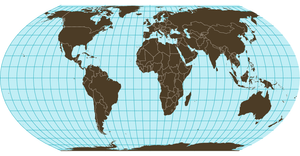
My World Map
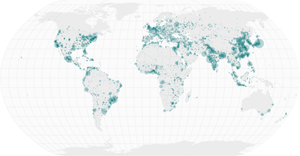
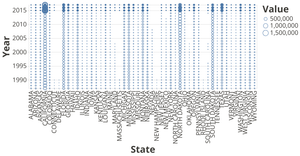
Sized Points on a Map

Steve's Interactive Scatter Plot with Color and Legend
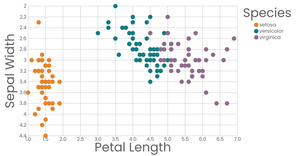
Steve's Scatter Plot with Color and Legend
Sized Points on a Map
Bee Colony Statistics by State and Year
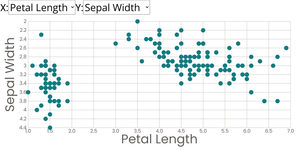
Steve's Scatter Plot with Menus

Steve's Menus with React Example

Steve's React Starter
Fireworks on Canvas
My World Map

Stylized Scatter Plot

Stylized Scatter Plot
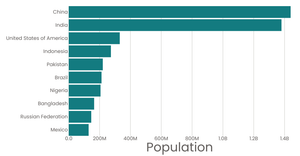
Steve's stylized barchart
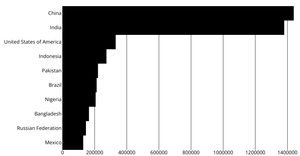
Steve's refactored barchart

Loading and Parsing CSV Data for Bee Colony Census Data by County

Loading and Parsing CSV Data for Bee Colony Loss Data

Loading and Parsing CSV Data for Bee Colony Census Data by State
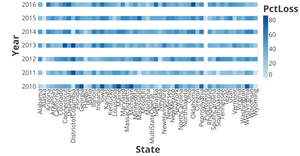
Percent Bee Colony Loss by State and Year - a Vega-Lite MarkSquare Heatmap
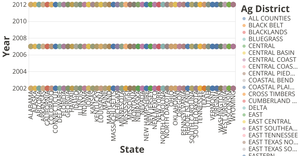
Agricultural District Prominence of Bee Colony Population by State - Hue Variation of Ag District by State (X axis) and Year (Y axis)