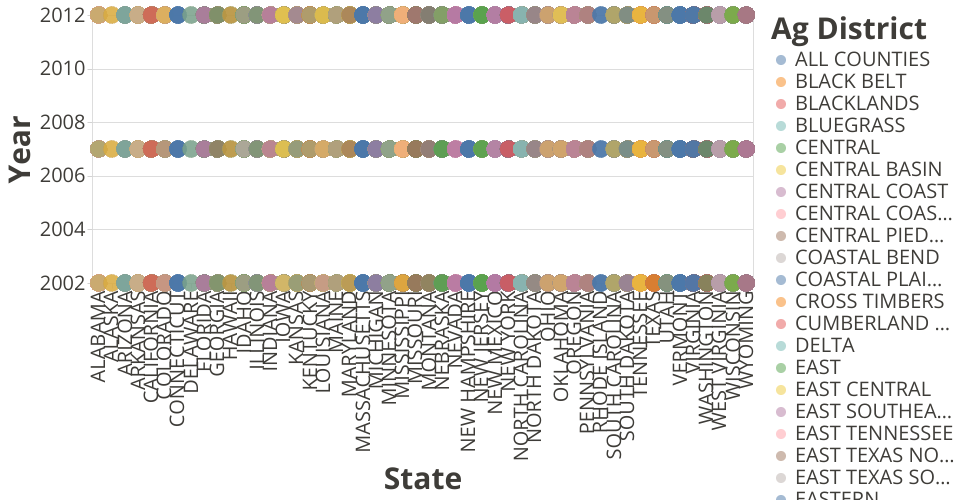
A visualization constructed using the vega-lite-api taking advantage of the markCircle function and the separation of data by color.
This visual depicts data from Bee Colony Census Data by County.csv.
Each circle represents the agricultural district distribution of bees in the state during the denoted year (when the census was taken).
MIT Licensed