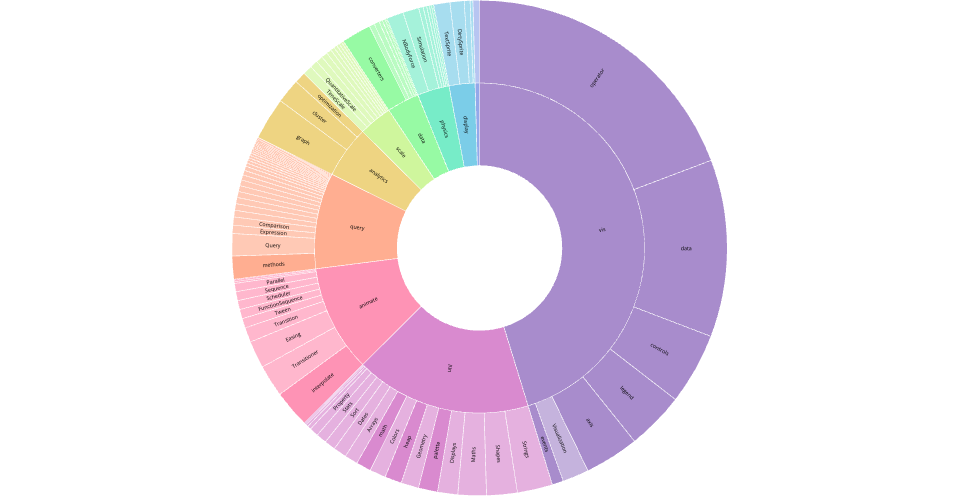
An example of porting a work from observablehq into VizHub. This is a direct port of Mike Bostock’s Sunburst, modified to fit the Bee Colony loss data.
The data for this version was generated using a script from https://beta.vizhub.com/bootshine2/beebcddb5fed4c7783b242816468ba9e. Not sure how to automate the file create from the script, or it would use the original CSV file at https://gist.githubusercontent.com/bootshine2/dc83fa6615ecf51fb382e233bf90840a/raw/b36dc061260662b23849d71599d12b336ce027c9/Bee%2520Colony%2520Loss4.csv and would autogenerate the flare.json file.
MIT Licensed