🌍 Public
Mexico Region Map ( D3 & React & TopoJSON )
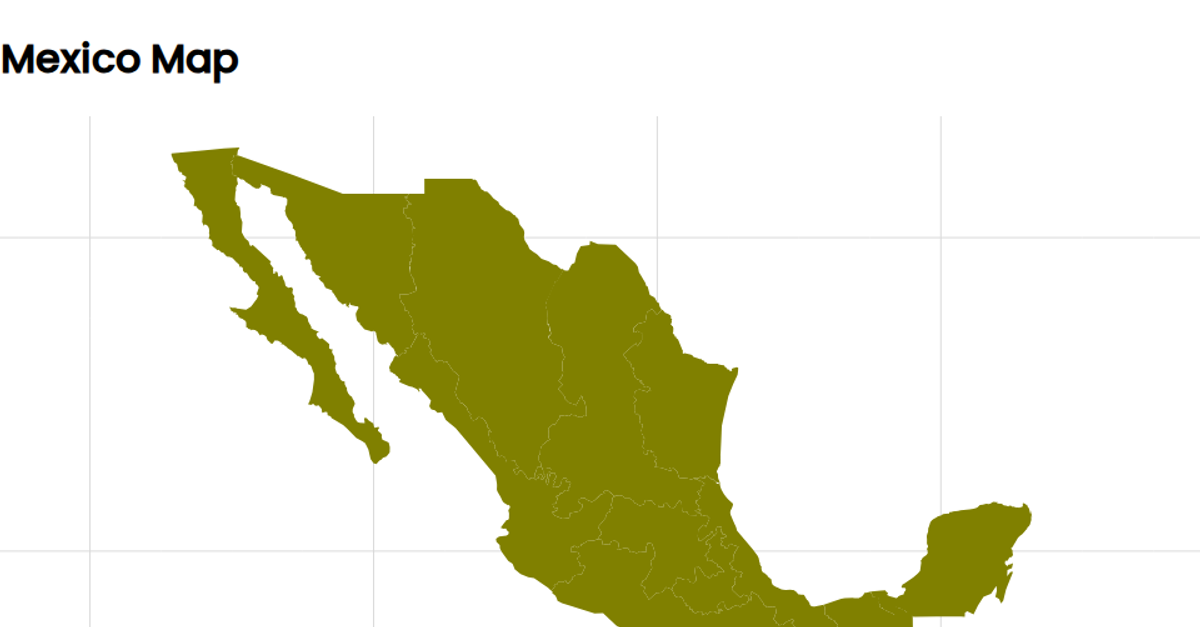
This example displays a map of Mexico rendered as a single-color choropleth, with state boundaries outlined and a graticule overlay. The visualization uses a Mercator projection via `d3.geoMercator` with the map centered on the country. The geographic data is loaded from a TopoJSON file fetched with `d3.json` and converted to GeoJSON using `topojson.feature`, with the shapes drawn by `d3.geoPath`. The implementation is built with React, managing the asynchronous data fetching through a custom hook and rendering the SVG marks as React components.
AI-generated descriptionused arcgis.com data for plotting states and boundaries mapshaper.org to create JSON of states witin mexico using mercator projection Still need to center on the rendered image
MIT Licensed



Comments
Sign in to join the discussion.